EU OSI for nitrogen
Gerard Ros & Elise van Eynde
2025-12-12
eu_osi_for_nitrogen.RmdIntroduction
Nitrogen (N) is one of the most important nutrients for plant growth, playing a central role in proteins, enzymes, chlorophyll, and other essential biomolecules. In soil health assessments, N is a key indicator because it reflects both the N supplying capacity of the soil and the functioning of the soil’s biological community. Adequate N availability supports vigorous plant growth, while deficiencies can limit productivity and lead to poor crop quality. However, nitrogen must be present in balanced forms; excessive levels, particularly of nitrate, can signal nutrient imbalances or management practices that increase leaching and environmental losses. The soil nitrogen cycle is driven by a complex interplay of biological, chemical, and physical processes. Organic nitrogen in soil organic matter must be mineralized by microorganisms into ammonium (NH₄⁺), and then further transformed through nitrification into nitrate (NO₃⁻), which is readily available to plants but also prone to leaching. The efficiency of these processes depends on soil health factors such as microbial diversity, aeration, moisture, pH, and organic matter content. A healthy soil maintains a dynamic nitrogen cycle that meets plant needs while minimizing losses through leaching, denitrification, or volatilization.
Measuring soil nitrogen provides insights not only into current fertility status but also into the underlying biological activity and organic matter dynamics. Tests such as total nitrogen, potentially mineralizable nitrogen (PMN), and inorganic nitrogen fractions help identify whether the soil can sustain crop needs throughout the growing season. High PMN values, for instance, often indicate a well-functioning microbial community and good organic matter quality. In contrast, low nitrogen levels can point to degraded soils with poor biological activity, low organic matter, or excessive nutrient losses.
The European Open Soil Index assesses the soil function for N supply
using the agronomic knowledge base as being used in the various EU
countries. This is done via an assessment of the microbial activity
(using the PMN test, see osi_b_pmn) and the N supplying
capacity (see osi_c_nitrogen). Both soil health indicators
are unitless and ranging between zero (poor quality) and one (optimum
quality). This indicator score reflects the ‘distance to target’
(i.e. difference between the current and optimum situation, while
ensuring that other soil functions are not limiting). The further it
deviates from score 1, the poorer the soil function works. An indicator
value of 0.5 approximately corresponds to the threshold level of the
fertilization guidelines under which (additional) fertilization is
recommended (given the ‘buildup and maintenance’ approach as being
implemented in fertilizer recommendation systems). Overall, the
indicator value can be interpreted as good (>0.75), sufficient
(0.5-0.75), and poor (<0.5).
The soil N wrapper functions
The euosi package has two wrapper function to assess the soil health
index in view of the key role of soil nitrogen supporting crop
produciton across Europe. This implies that two soil health indicators
are caculated. The first wrapper function is osi_c_nitrogen
and the second one is osi_b_pmn.
The function
osi_c_nitrogen requires the following inputs:
- B_LU (character) The crop code
- B_SOILTYPE_AGR (character) The soil type in a particular region
- A_CLAY_MI (numeric) The clay content of the soil (%)
- A_SAND_MI (numeric) The sand content of the soil (%)
- A_SOM_LOI (numeric) The organic matter content of the soil (%)
- A_C_OF (numeric) The organic carbon content in the soil (g C / kg). Optional.
- A_PH_CC (numeric) The pH measured in CaCl2 extraction.
- A_CACO3_IF (numeric) the percentage of CaCO3 (%)
- A_N_RT (numeric) The organic organic nitrogen content of the soil (mg N / kg)
- B_COUNTRY (character) The country code
The function osi_b_pmn requires the following
inputs:
- B_LU (character) The crop code
- B_SOILTYPE_AGR (character) The soil type in a particular region
- A_CLAY_MI (numeric) The clay content of the soil (%)
- A_N_RT (numeric) The organic organic nitrogen content of the soil (mg N / kg)
- A_N_PMN (numeric) The potentially mineralizable N pool (mg N / kg soil)
- B_COUNTRY (character) The country code
The wrapper function wraps country specific N assessment functions.
In contrast to phosphorus and potassium are most of the existing N
fertilizer systems based on a simple mass balance approach using
inorganic N measurements as guide to correct for available N in soils.
The majority of the N fertilizer systems in Europe do not have an
underpinned estimate of the capacity of soils to supply N. Similarly,
the use of PMN to adjust or optimise N fertilization is quite rare in
Europe.
At the moment the euosi package has country specific
functions for the N supply for the Netherland, Belgium, Germany and
France. For all other countries, the euosi package uses a generic
estimation of the N supply, following a simple first order decomposition
constant of the soil organic nitrogen involved (see
osi_c_nitrogen_eu). Similarly, only the Netherlands
evaluate soil health using the PMN method. Also here, the euosi package
uses a generic PMN assessment method following the Dutch approach (see
osi_b_pmn_eu).
The European assessment for soil N
To evaluate the capacity of soils to supply nitrogen, the euosi assumes that annualy 2% of the soil organic matter is decomposed. Following the stochiometry of the carbon and nitrogen in soil, the N supply is calculated accordingly. A more detailed approach using RothC modelling is also possible, but it requires far more inputs regarding carbon and nutrients (from manure, compost, crop residues, and exudates). For that reason we applied a more simple approach following the classic agronomic organic matter balance. See for example the tool being used by various farmers across Europe: www.os-balans.nl.
The different steps are illustrated below. First the bulk density is estimated using a pedotransfer function. Then an annual decomposition rate is set at 2%. Third, the N supply is estimated from the total N content and the annual decomposition rate. The N supply is maximised at 600 kg N/ha. We assume that around 25% of this mineralized N is available in springg and during the early stages of growth (4 months, assuming linearity over the year). This N mineralized is corrected for eventual losses that occur during the winter period, and is set at 50%. This value might be updated based on the precipitation surplus and leaching risk (to be done). Finally this results in an estimate of the total amount of inorganic N being available in spring. Using a logistic scoring with an optimum of around 40 kg N/ha, we calculated the soil health index for nitrogen.
  # estimate bulk density via pedotransfer function
  dt[, BD := (1/(0.02525 * A_SOM_LOI + 0.6541)) * 1000]

  # set annual decomposition rate of 2%
  dt[, arate := 0.02]

  # estimate N supply for top 30 cm soil layer, set at max at 600 kg / yr
  dt[, NSC := pmin(600,(100 * 100 * 0.3 * BD) * A_N_RT * arate * 0.001 * 0.001)]

  # assume that 25% is mineralized in winter, and available in pre-season
  dt[, NSCPS := 0.25 * NSC]

  # correction for losses (a generic 50%, might make dependent on precipitation surplus)
  dt[, NSCPS := (1- 0.5) * NSCPS]

  # convert to OSI score, optimum is 125 kg N / ha / yr
  dt[, value := osi_evaluate_logistic(x = NSCPS, b = 0.13683559, x0 = -14.84508232, v = 0.03487421)]
A common indicator to assess soil microbial activity is potentially mineralizable nitrogen (PMN). PMN is the capacity of soil microbes to mineralize organic nitrogen into plant available form of nitrogen, and usually measured with anaerobic or aerobic incubation methods. The potential microbial activity is evaluated using a more-is-better logistic curve with an optimum PMN value around 45 mg N /kg, following the scoring function of the CASH model for soil health. When PMN is not measured, it is estimated from the total N content (being the main driver for the potential mineralization rate as being determined with the PMN text). The pedotransfer function an the scoring evaluation is illustrated below.
  # built on the large dataset of Dutch soils (R2 = 0.79, N=109.146 samples)
  dt[, PMN := exp(-3.440931 + 1.1012449 * log(A_N_RT) - 0.055858 * log(A_CLAY_MI))]

  # convert to OSI score
  dt[, value := osi_evaluate_logistic(x = PMN,b = 0.2, x0 = 20,v = 1.2)]
Lets show a real example given the OSI farm data in the euosi
package. We first read the properties of the fields belonging to that
farm, and then estimate the soil health index for nitrogen using the
European assessment functions. The dataset contains soil properties from
60 agricultural fields and is documented in ?osi_farm. When
interested, look to the summary of the
osi_farm object.
Suprisingly the soil health index score is very high for both indicators: for the set samples it is around 0.99, being almost equal to the maximum score. This requires further evaluation in view of the assumptions made for the virtual farm or the actual variation across Europe.
  # read the data from the OSI farm
  dt.of <- copy(euosi::osi_farm)

  # estimate the soil health score for the N supplying capacity
  dt.of[, osi_c_n := osi_c_nitrogen_eu(B_LU = B_LU, A_CLAY_MI = A_CLAY_MI,
                                       A_SAND_MI = A_SAND_MI,A_SOM_LOI = A_SOM_LOI, A_C_OF = A_C_OF,
                                       A_N_RT = A_N_RT, B_COUNTRY = B_COUNTRY)]

  # estimate the soil health score for microbial activity
  # for this example, total N is reduced with 50% to see some variation in the boxplot
  dt.of[, osi_b_n := osi_b_pmn_eu(B_LU = B_LU, A_CLAY_MI = A_CLAY_MI, A_N_RT = A_N_RT * 0.5)]

  # show a boxplot for both PMN and N supplying capacity
  dt.melt <- melt(dt.of,id.vars='ID',measure.vars = c('osi_c_n','osi_b_n'),)
  dt.melt[,value := mean(value),by=c('ID','variable')]

  # rename
  dt.melt[,variable:= factor(variable,
                             levels = c('osi_c_n','osi_b_n'),
                             labels = c('nitrogen\nsupply','microbial\nactivity'))]
  # plot a boxplot
  ggplot(data = dt.melt,aes(y=variable,x=value)) +
         geom_boxplot(fill = '#238b45',alpha = 0.6) + theme_bw() + xlab('')+ylab('shi score')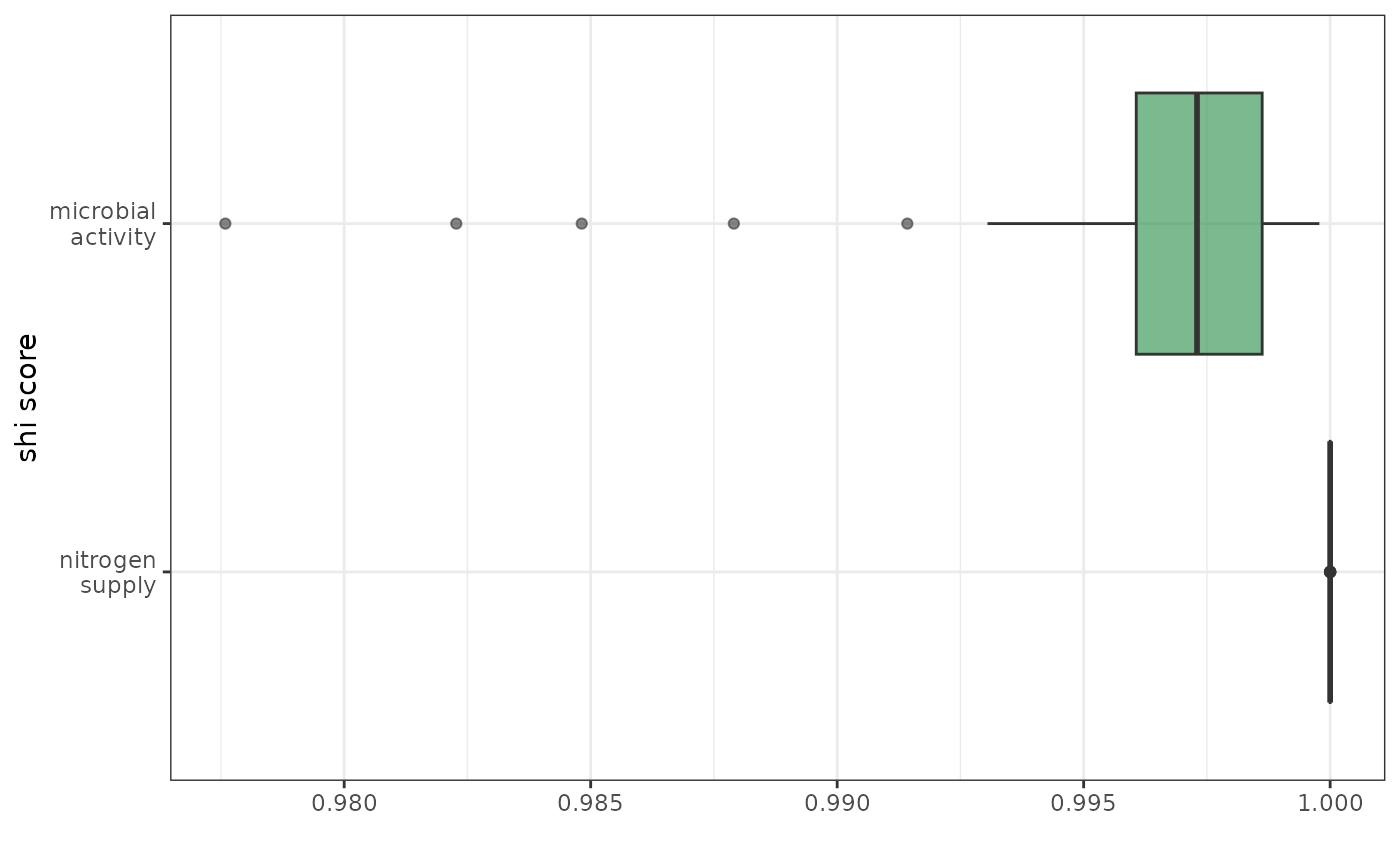
Evaluation N-indicator for Europe.
Austria (AT)
There is no country specific assessment for soil nitrogen yet, and the European assessment is applied.
Belgium (BE)
In Belgium, the capacity of soils to supply N is calculated
(osi_c_nitrogen_be) using an empirical algorithm. First,
the potentially available N pool is estimated as a function of total N
and the bulk density. Second, the mineralization of this N pool is
estimated as a function of the clay and carbonate content. The equation
is illustrated below:
# estimate bulk density
dt[, BD := 0.80806 + 0.823844*exp(0.0578*0.1*A_C_OF) + 0.0014065 * A_SAND_MI - (0.0010299 * A_CLAY_MI)]
# estimate helper variables
dt[,D_NHA := A_N_RT * 0.2 * BD * 10000 * 1000 * 10^-6]
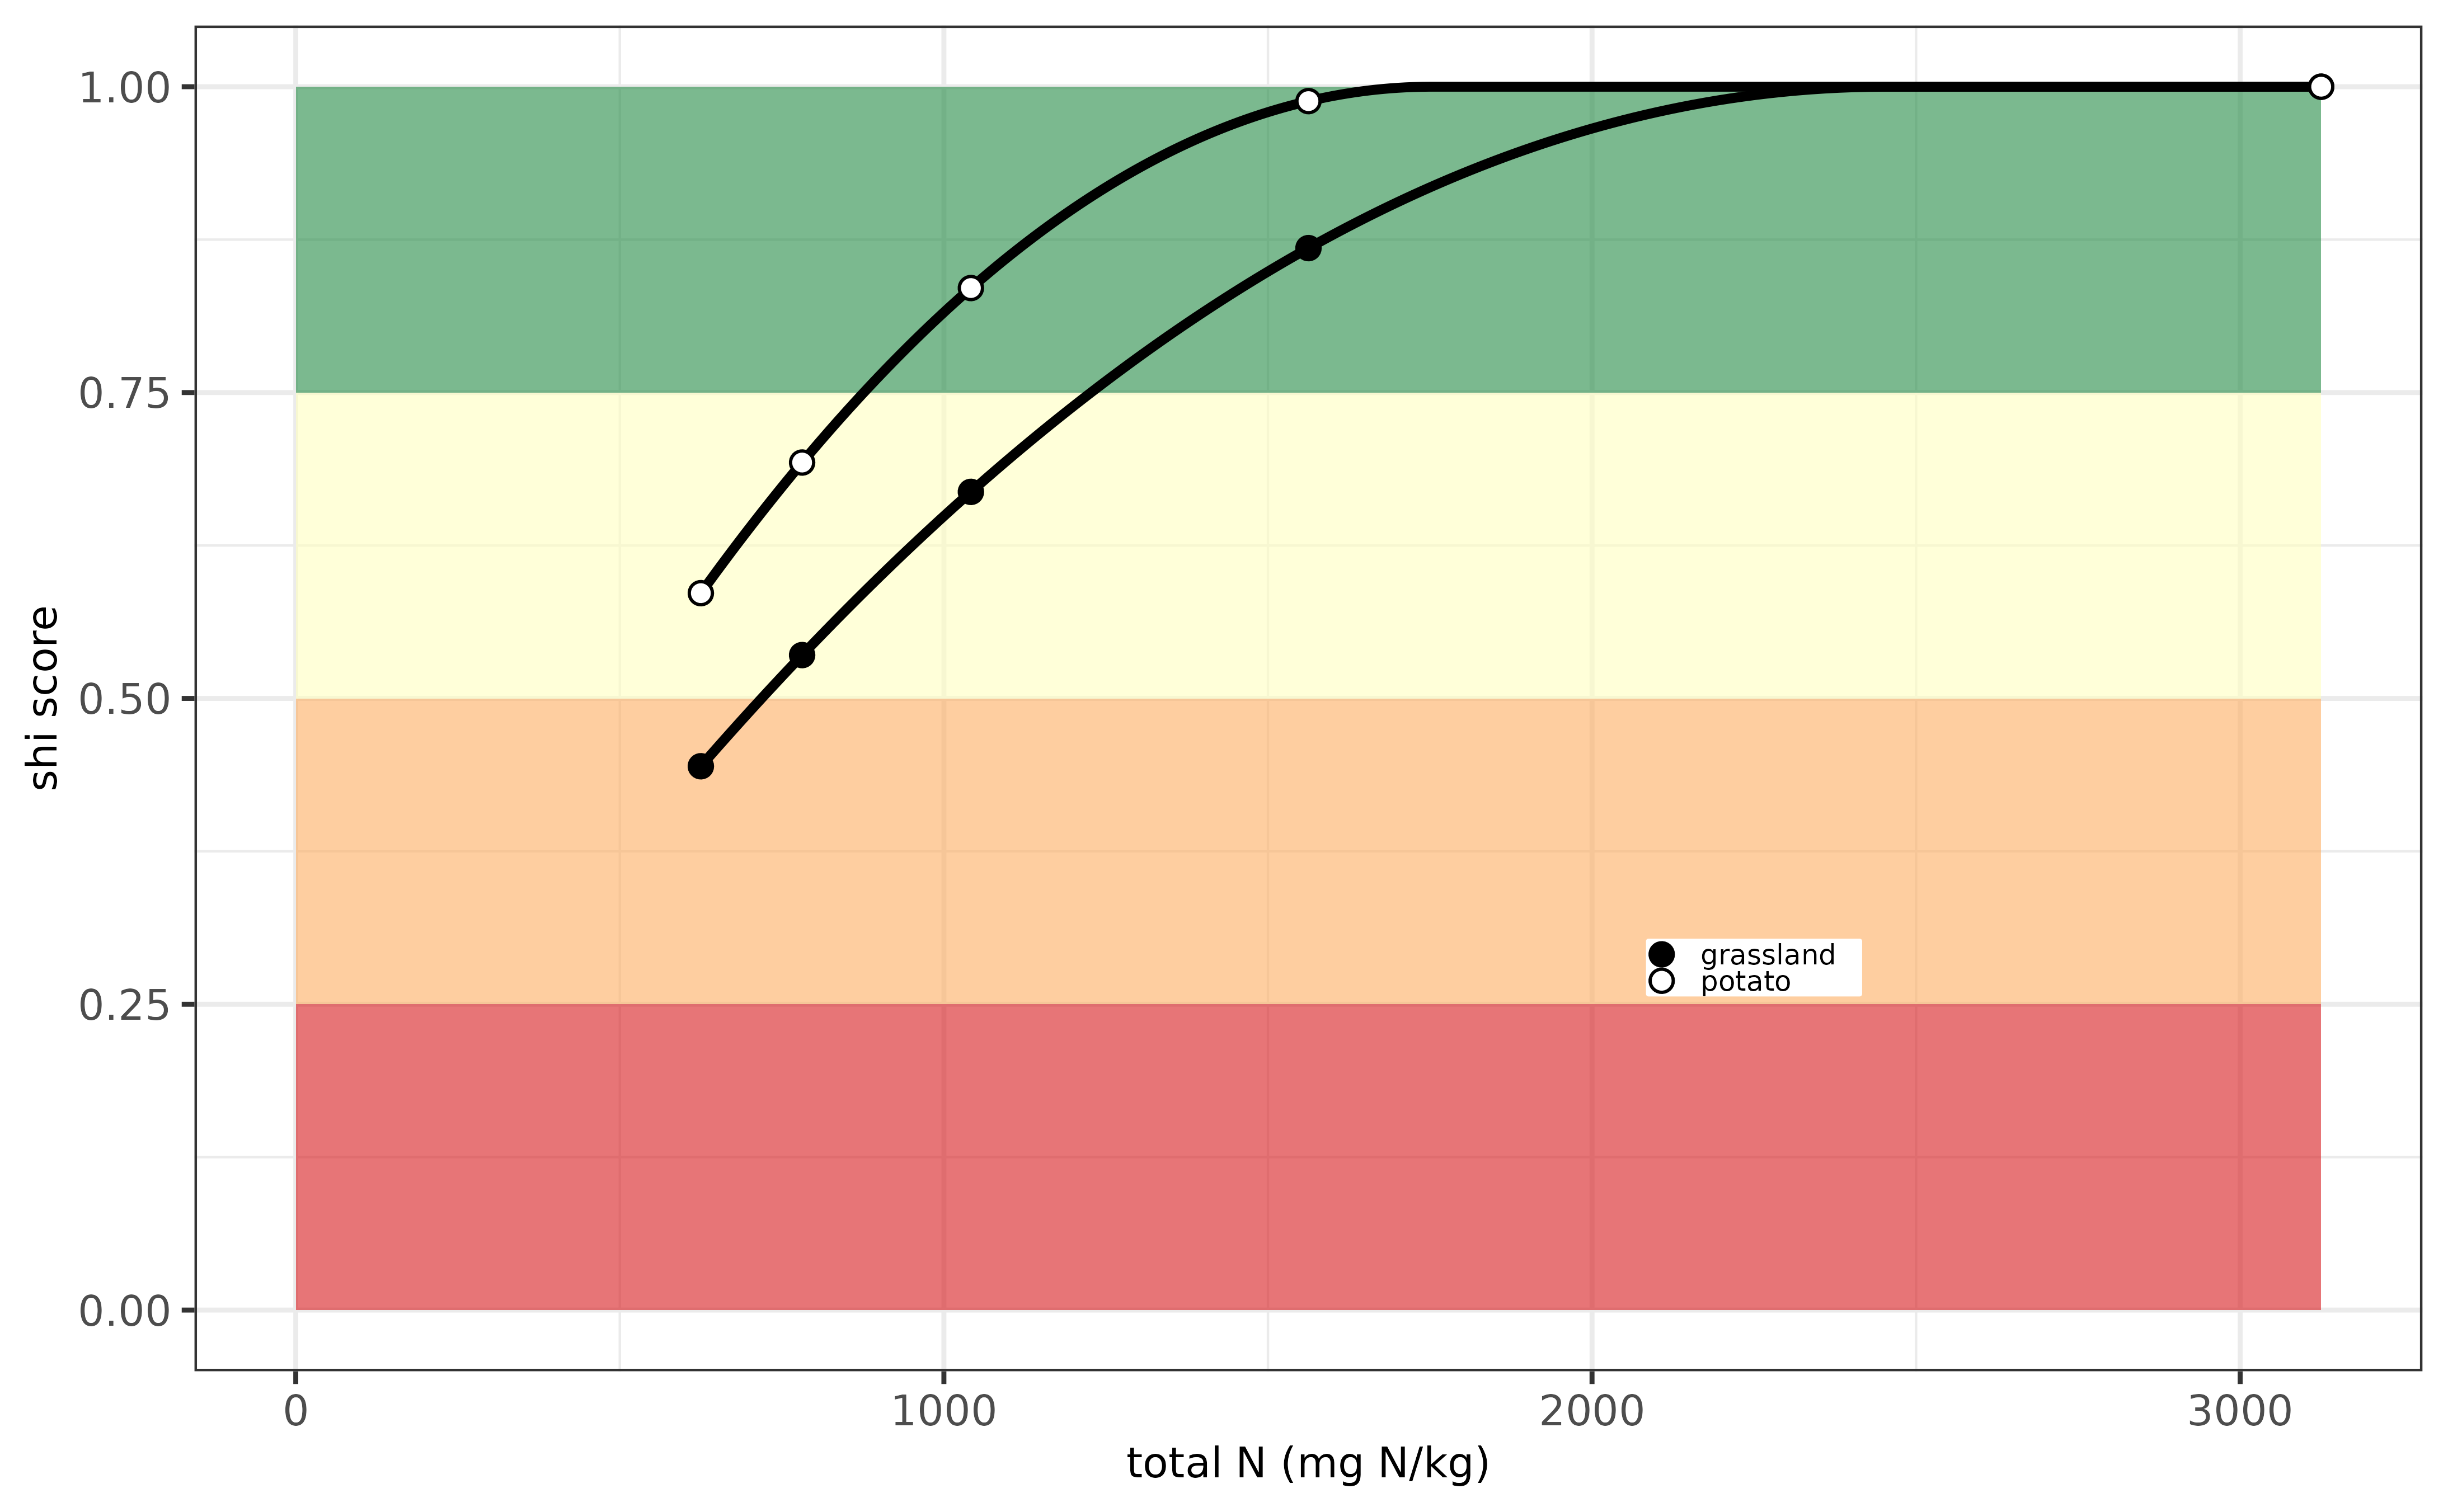
dt[,D_NSC := (22/((12+A_CLAY_MI)*(545+A_CACO3_IF))) * D_NHA * 21.35 * 0.33]The N supplying capacity is subsequently evaluated using a parabolic
evaluation function, being different for grassland and arable crops. The
optimum is set on 100 kg N/ha for cropland and on 140 kg/ha for
grassland. Note that the thresholds are set equal to France (might be
updated later).
When applied for a potato crop (code = 906) and
grassland (code = 745) and a series of soils varying in total N content,
we illustrate that the soil health index for the N supplying capacity
varies from zero (in the case that no N is present, assuming an
unrealistic high CN ratio) up to the maximum score when the total N
content is around 1500 mg N/kg for potato and around 2000 mg N/kg for
grassland.
Evaluation N-indicator for Belgium.
Switzerland (CH)
There is no country specific assessment for soil nitrogen yet, and the European assessment is applied.
Czech Republic (CZ)
There is no country specific assessment for soil nitrogen yet, and the European assessment is applied.
Germany (DK)
For Germany the N fertilizer recommendation system is essentially a N
balance calculation starting with the so called N-Sollwert,
being the nitrogen requirement of the crop. The term “Sollwert”
expresses the optimum (inorganic) nitrogen content in soil desired for
achieving maximum yield performance under a given set of agronomic
conditions. The N-Sollwert is derived from extensive field trials
establishing the N needs of various crops under normal conditions, after
which additions and deductions due to considerations of other factors
are made (e.g. presence of stones in soil). More information can be
found here.In
sort, the N-sollwert is adjusted for the level of inorganic N at the
start of the growing season, the capacity of soils to supply N, and crop
related N inputs during the season. In more detail:
- measure Nmin: The existing inorganic nitrogen in soil is subtracted from the reference set point (i.e. the desired N level in the soil, according to the crops’ optimal N condition to achieve optimal yield).
- soil characteristics, including texture, organic matter composition, and potential for mineralisation, significantly affect the dynamics of nitrogen, and hence are taken into account to adjust the N-Sollwert.
- crop rotation and residues: The residual nitrogen contributions from
previous crops, mainly legumes, and organic fertilisers need to be
subtracted from the N-Sollwert as well.
Note that the crop codes for Germany are not yet available inosi_cropspackage table. So, regarding the assessment of soil N supply, there is currently not a crop specific evaluation.
The implementation of this calculation ineuosiis done as follows:
# add soil type based deduction factor, with stype being dependent on clay, sand and SOM content
dt[stype %in% c('BG1','BG2'), cf1 := 0.25]
dt[stype %in% c('BG3','BG4'), cf1 := 0.50]
dt[stype %in% c('BG5'), cf1 := 0.25]
dt[stype == 'BG6', cf1 := 0]
# estimate bulk density via pedotransfer function
dt[, BD := (1/(0.02525 * A_SOM_LOI + 0.6541)) * 1000]
# set annual decomposition rate of 2%
dt[, arate := 0.02]
# estimate N supply for top 30 cm soil layer
dt[, NSC := (100 * 100 * 0.3 * BD) * A_N_RT * arate * 0.001 * 0.001]
# assume that 25% is mineralized in winter, and available in pre-season
dt[, NSCPS := 0.25 * NSC]
# correction per soil type (being related to losses)
dt[, NSCPS := (1- cf1) * NSCPS]
# evaluate soil health score for NSC calculation (optimum around 100 kg N supply / ha)
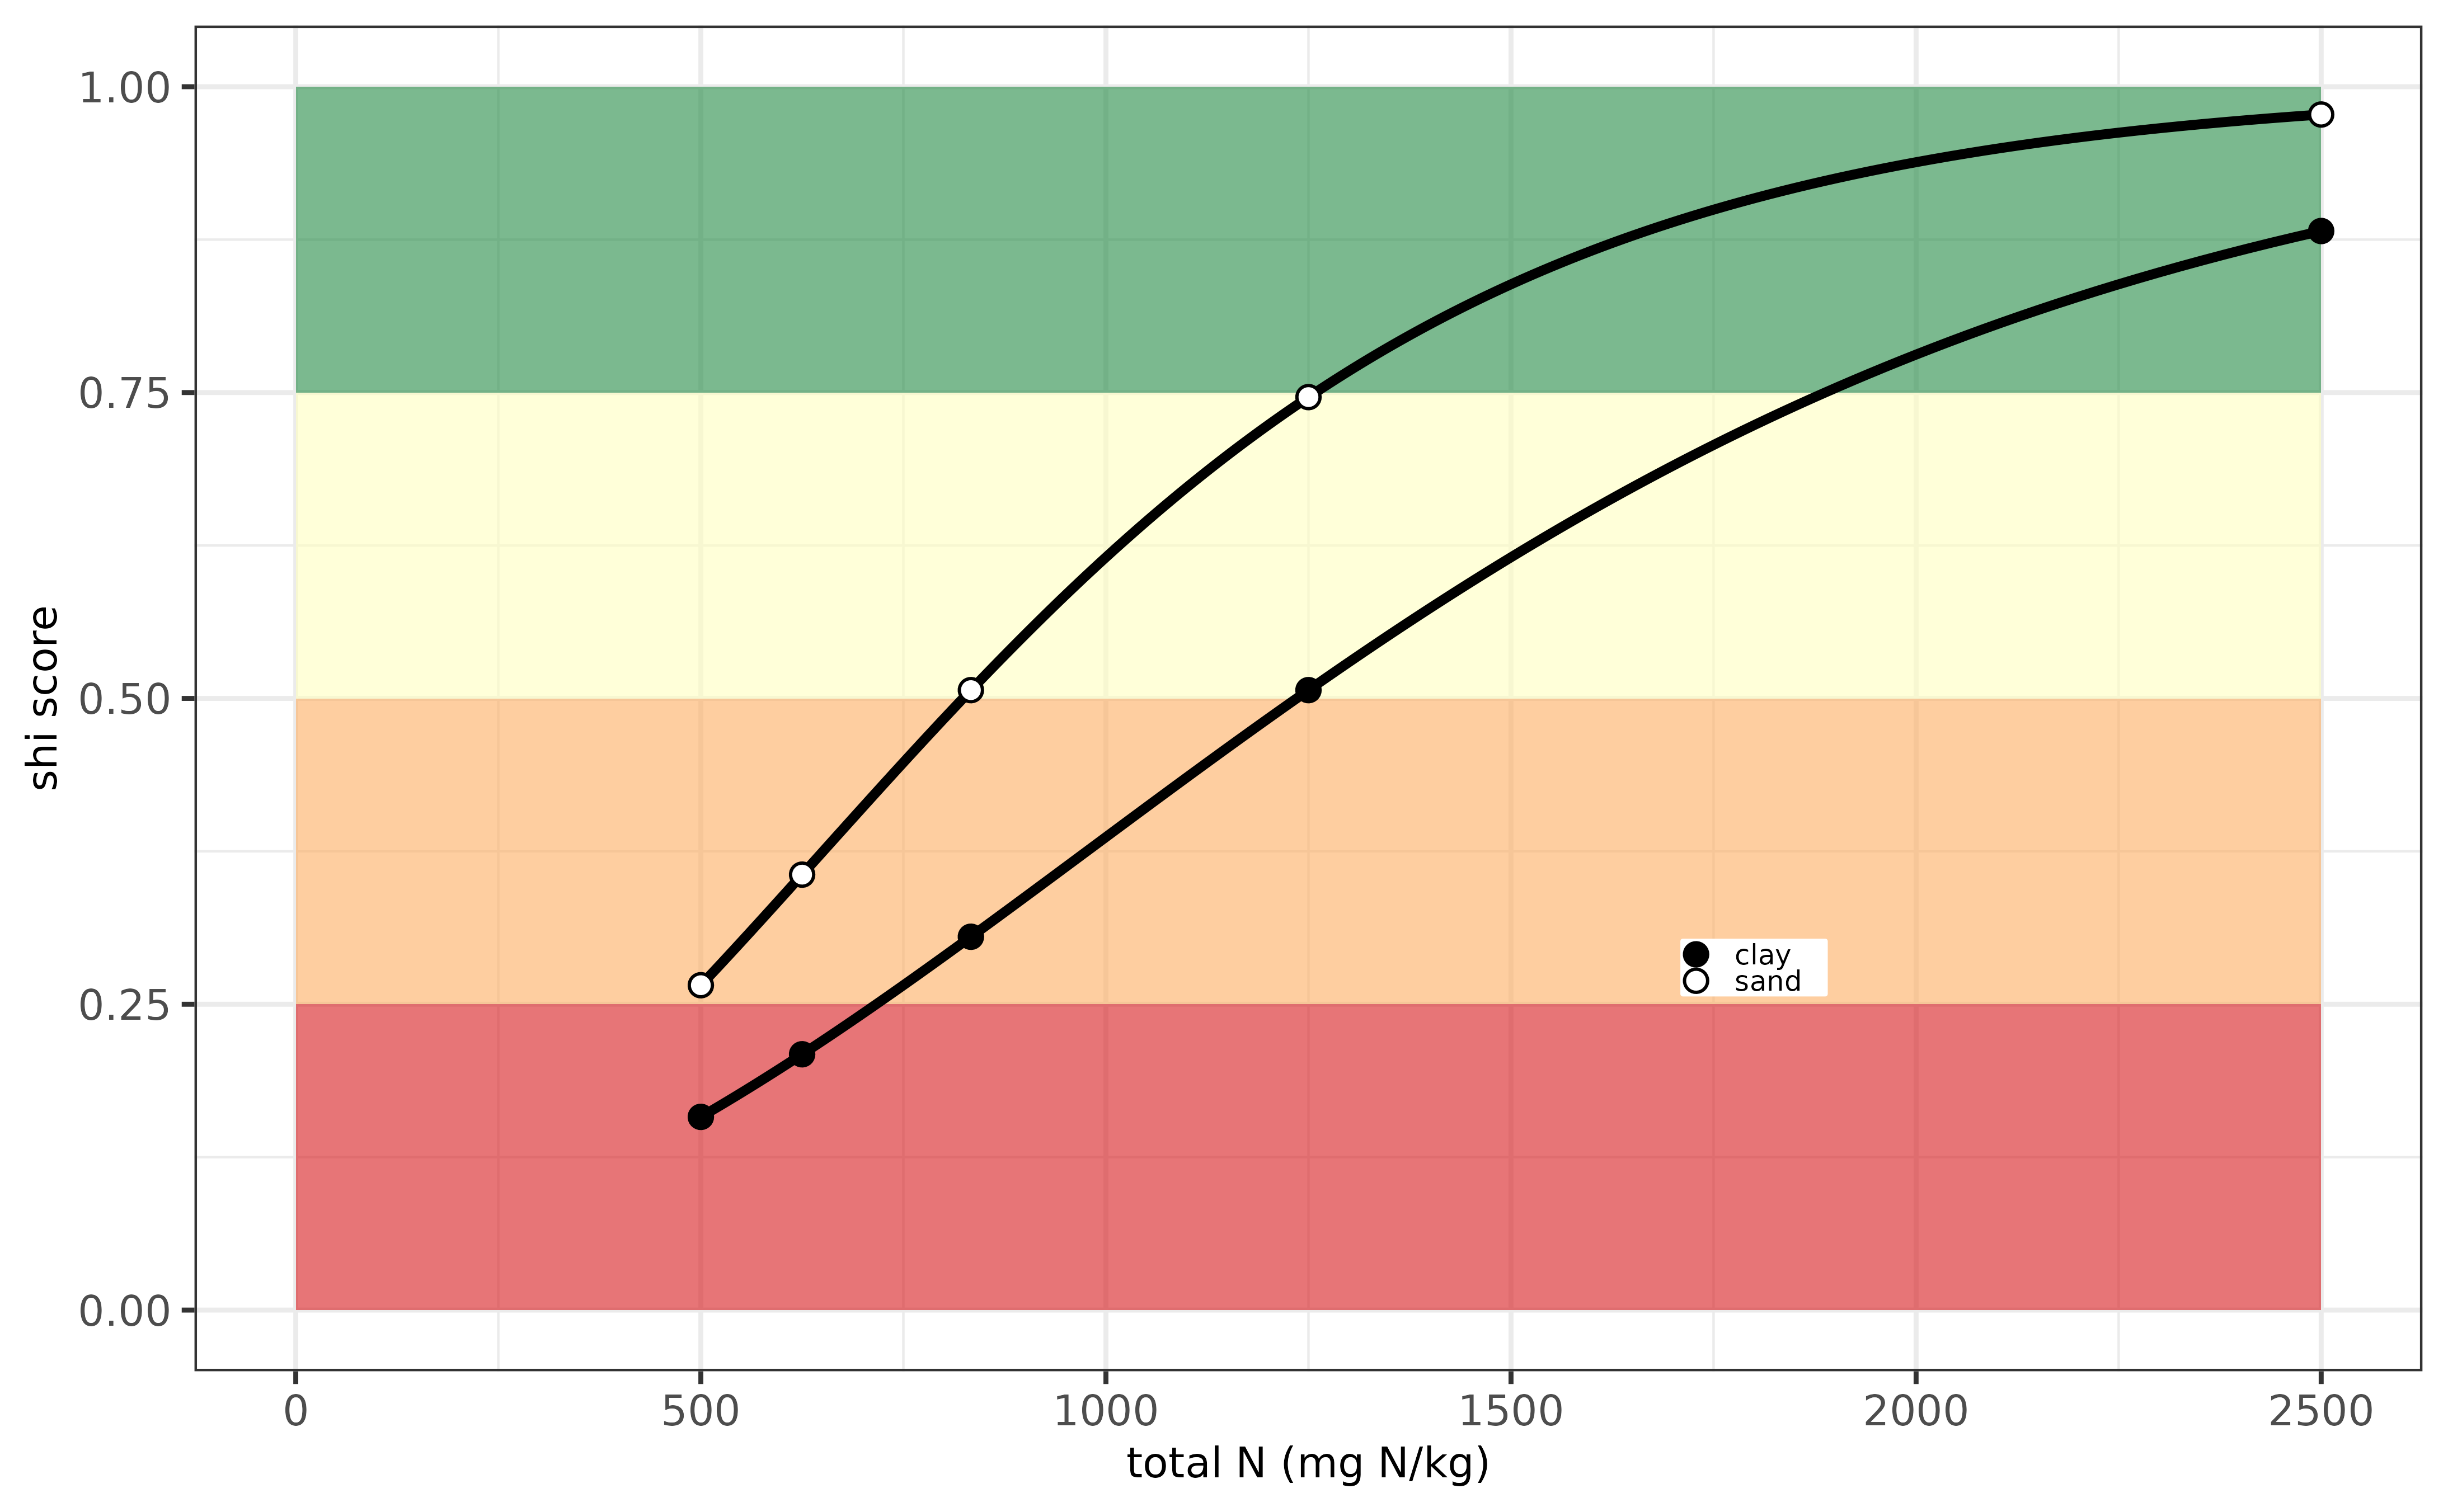
dt[, value := osi_evaluate_logistic(x = NSCPS, b = 0.13683559, x0 = -14.84508232, v = 0.03487421)]When applied on a sandy and clay soil in Germany, for soils with a CN ratio varying between 8 and (unrealistic) value of 40 to illustrate how the soil health index varies with total N in the soil. The soil health index was optimum as soon as the N supply resulted in 40 kg N/ha in spring. In these two examples illustrated this happens at soil N levels around 2000 mg N/kg. Lowering the total N content (or increasing the CN ratio) resulted in a declining soil index. The total N content is evaluated as being more available for sandy soils than on clay soils.
Evaluation N-indicator for Germany.
Estonia (EE)
There is no country specific assessment for soil nitrogen yet, and the European assessment is applied.
Spain (ES)
There is no country specific assessment for soil nitrogen yet, and the European assessment is applied.
Finland (FI)
There is no country specific assessment for soil nitrogen yet, and the European assessment is applied.
France (FR)
In France, the capacity of soils to supply N is calculated
(osi_c_nitrogen_fr) using an empirical algorithm. First,
the potentially available N pool is estimated as a function of total N
and the bulk density. Second, the mineralization of this N pool is
estimated as a function of the clay and carbonate content. The equation
is illustrated below:
  # calculate derivative supporting soil properties: bulk density and N pool (kg N / ha)
  dt[, BD := 0.80806 + (0.823844*exp(0.0578*0.1*A_C_OF)) + (0.0014065 * A_SAND_MI) - (0.0010299 * A_CLAY_MI)]
  dt[, D_NHA := A_N_RT * 0.2 * BD * 10000 * 1000 * 10^-6]

  # calculate the N supplying capacity for France (kg N/ha/yr)
  dt[, D_NSC := ((22/((12+A_CLAY_MI)*(545+A_CACO3_IF))) * D_NHA)*21.35 * 0.33]
The N supplying capacity is subsequently evaluated using a parabolic
evaluation function, being different for grassland and arable crops. The
optimum is set on 100 kg N/ha for cropland and on 140 kg/ha for
grassland.
When applied for a potato crop (code = PTC) and
grassland (code = PRL) and a series of soils varying in total N content,
we illustrate that the soil health index for the N supplying capacity
varies from zero (in the case that no N is present, assuming an
unrealistic high CN ratio) up to the maximum score when the total N
content is around 1500 mg N/kg for potato and around 2000 mg N/kg for
grassland.

Evaluation N-indicator for France.
Hungary (HU)
There is no country specific assessment for soil nitrogen yet, and the European assessment is applied.
Ireland (IE)
There is no country specific assessment for soil nitrogen yet, and the European assessment is applied.
Italy (IT)
There is no country specific assessment for soil nitrogen yet, and the European assessment is applied.
Latvia (LV)
There is no country specific assessment for soil nitrogen yet, and the European assessment is applied.
Lithuania (LT)
There is no country specific assessment for soil nitrogen yet, and the European assessment is applied.
Netherlands (NL)
The nitrogen supply on grasslands is estimated based on the empirical relationship of N supply and total N level, which also varies depending on the sampling depth, soil texture and the age of the grassland. For arable fields, the N supply is derived from a simple first order decomposition model, calibrated for Dutch circumstances and depending on soil texture, organic matter, and total N content. The total N supply is evaluated via a parabolic scoring function with an optimum of 100 kg N /ha in arable fields and 140 kg N /ha in grassland fields.
The euosi package implemented this in the function
osi_c_nitrogen_nl. This function requires the following
inputs:
- B_LU (character) The crop code
- B_SOILTYPE_AGR (character) The soil type in a particular region
- A_SOM_LOI (numeric) The organic matter content of the soil (%)
- A_N_RT (numeric) The organic organic nitrogen content of the soil (mg N / kg)
An example is illustrated below for a maize crop (crop code 265) and a single soil is:
  # show an example for maize crop
  osi_c_nitrogen_nl(B_LU = 265, B_SOILTYPE_AGR = 'dekzand',
                    A_SOM_LOI = 4, A_N_RT = 1050)
## [1] 0.9551067Below the same example but then visualised for a series of soils with a varying total N content and a fixed SOM content. This is done for two crops: grassland and maize. From this example one can see that the soil health index score is generally very high for grassland, and can by quite variable for arable land.
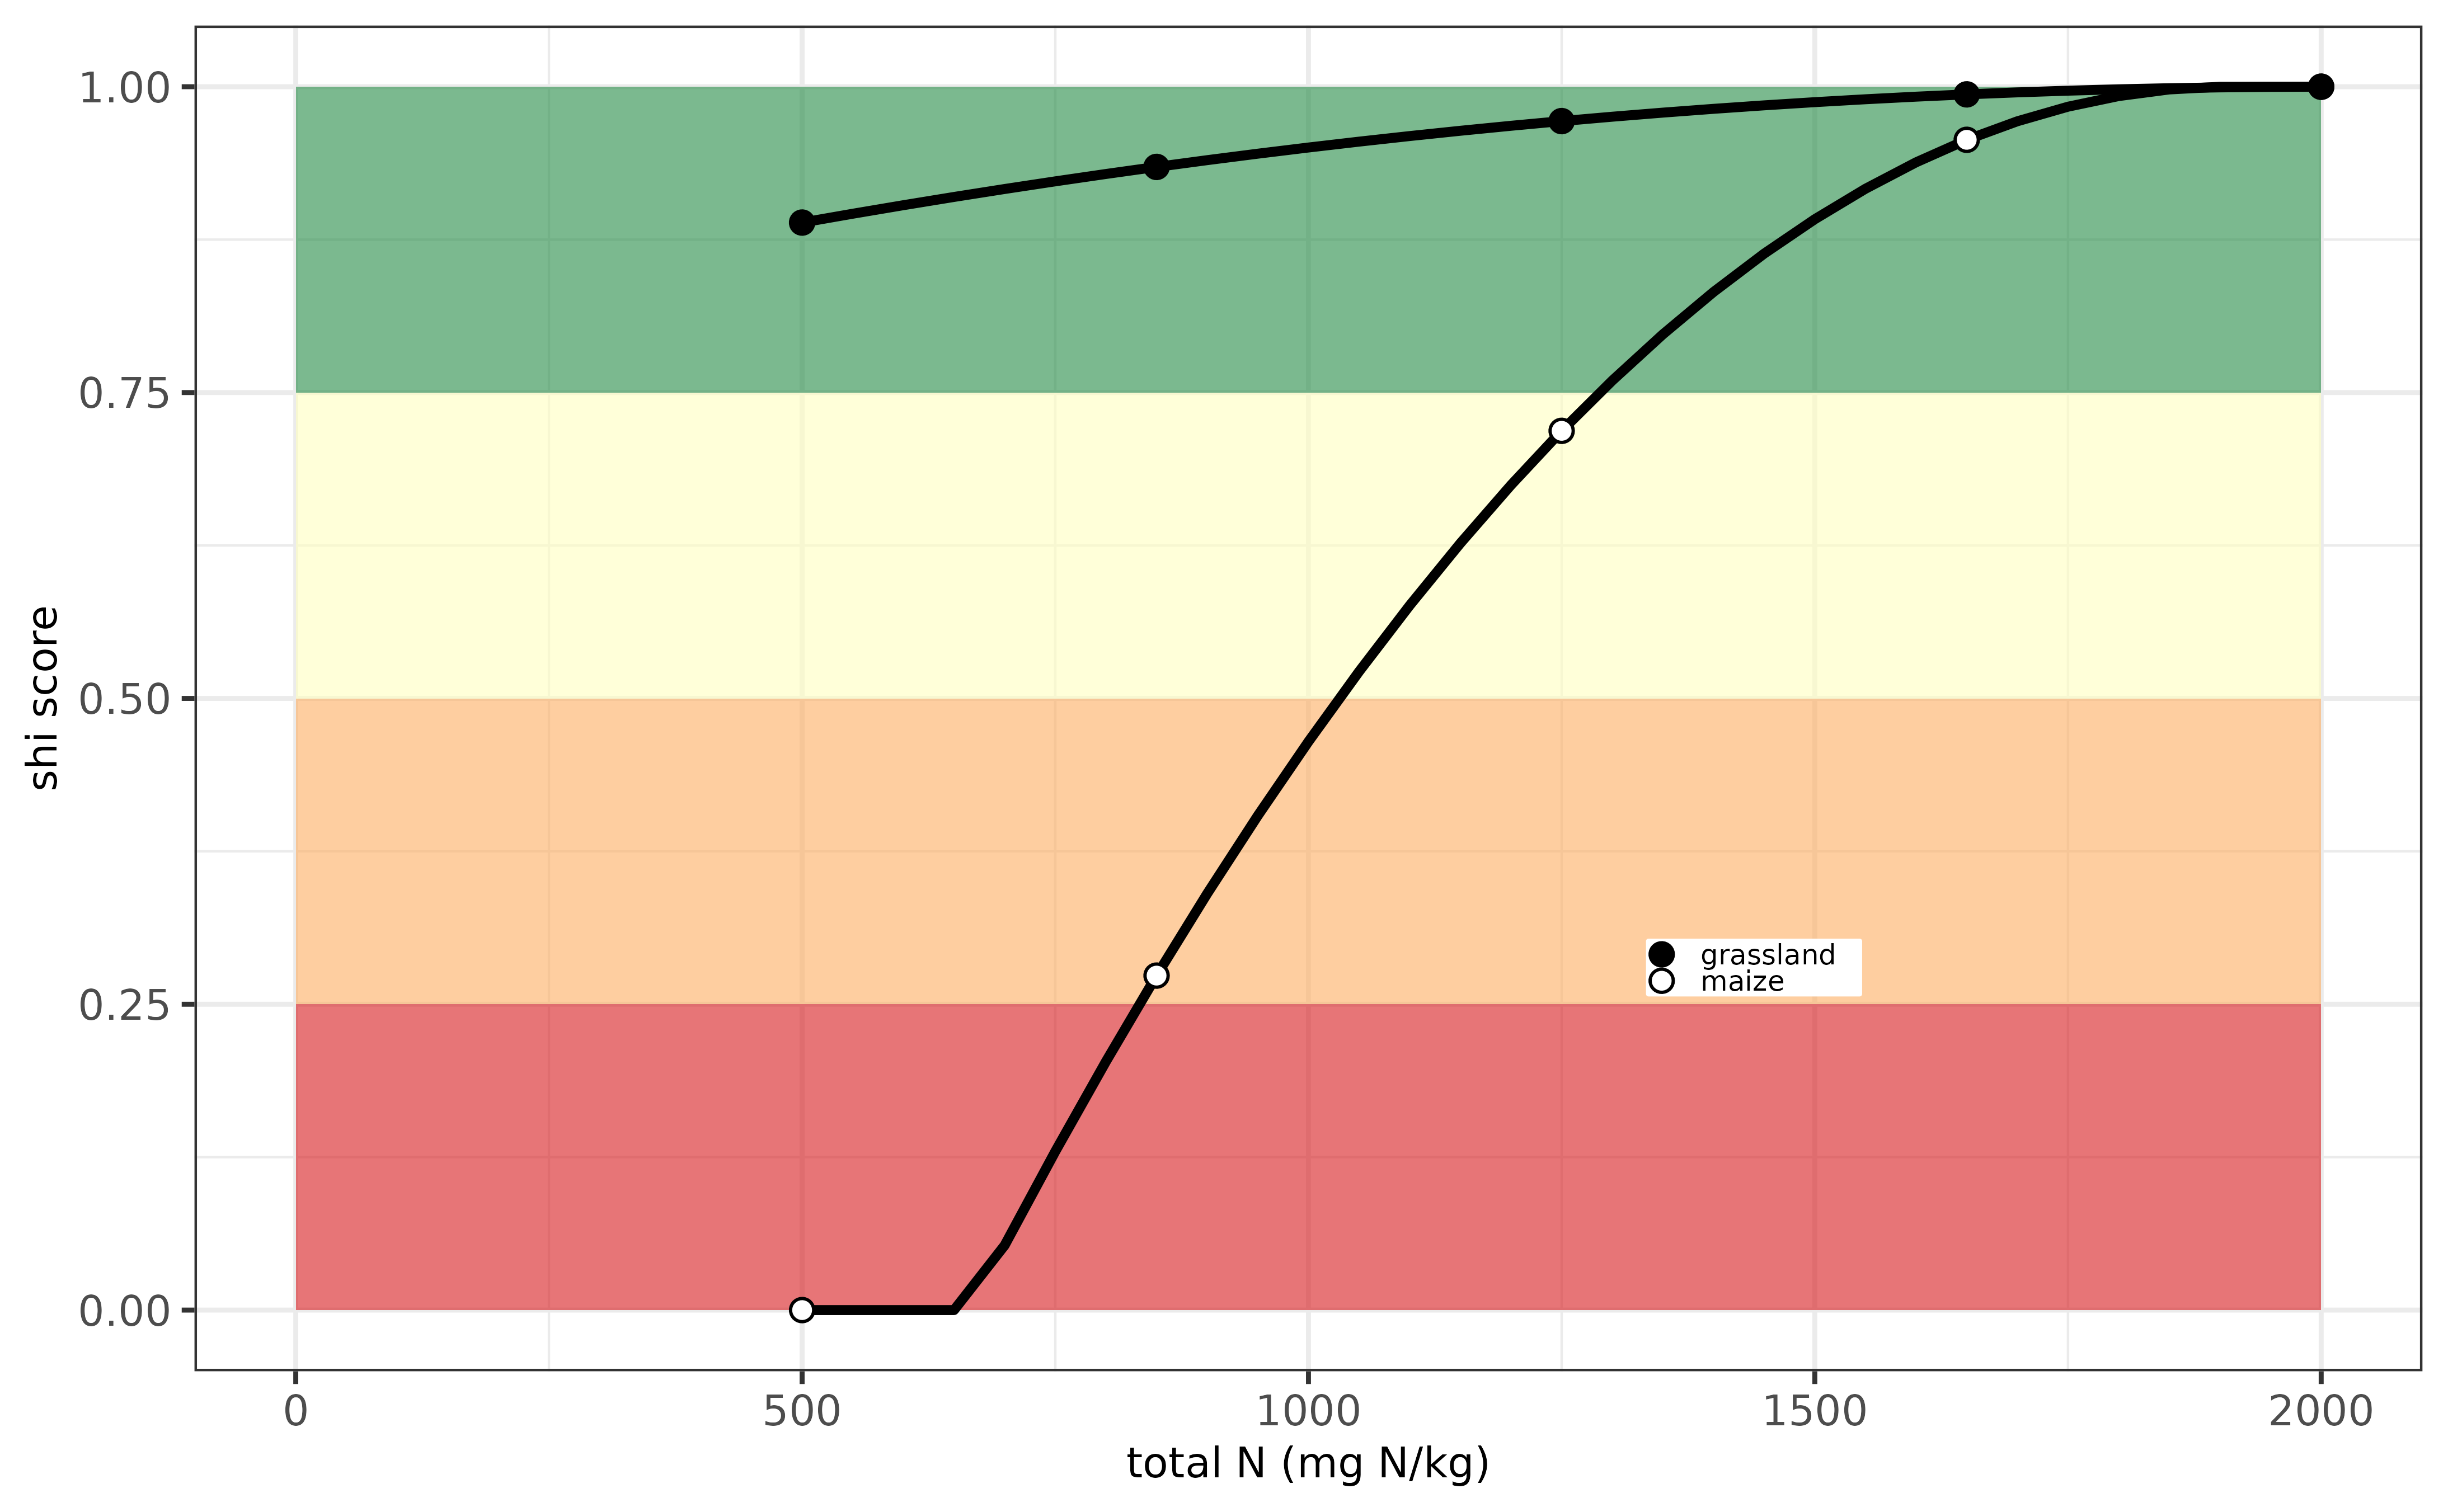
Evaluation N-indicator for the Netherlands.
The potential microbial activity is evaluated using a more-is-better logistic curve with an optimum PMN value around 45 mg N / kg. Again, an example is illustrated below for a maize crop (crop code 265):
  # show an example for maize crop
  osi_b_pmn_nl(B_LU = '265', B_SOILTYPE_AGR = 'dekzand',A_N_PMN = 25)
## [1] 0.7183917When applied to a series of soils with varying PMN levels, an now for potato and grassland, the soil health score looks as follows:
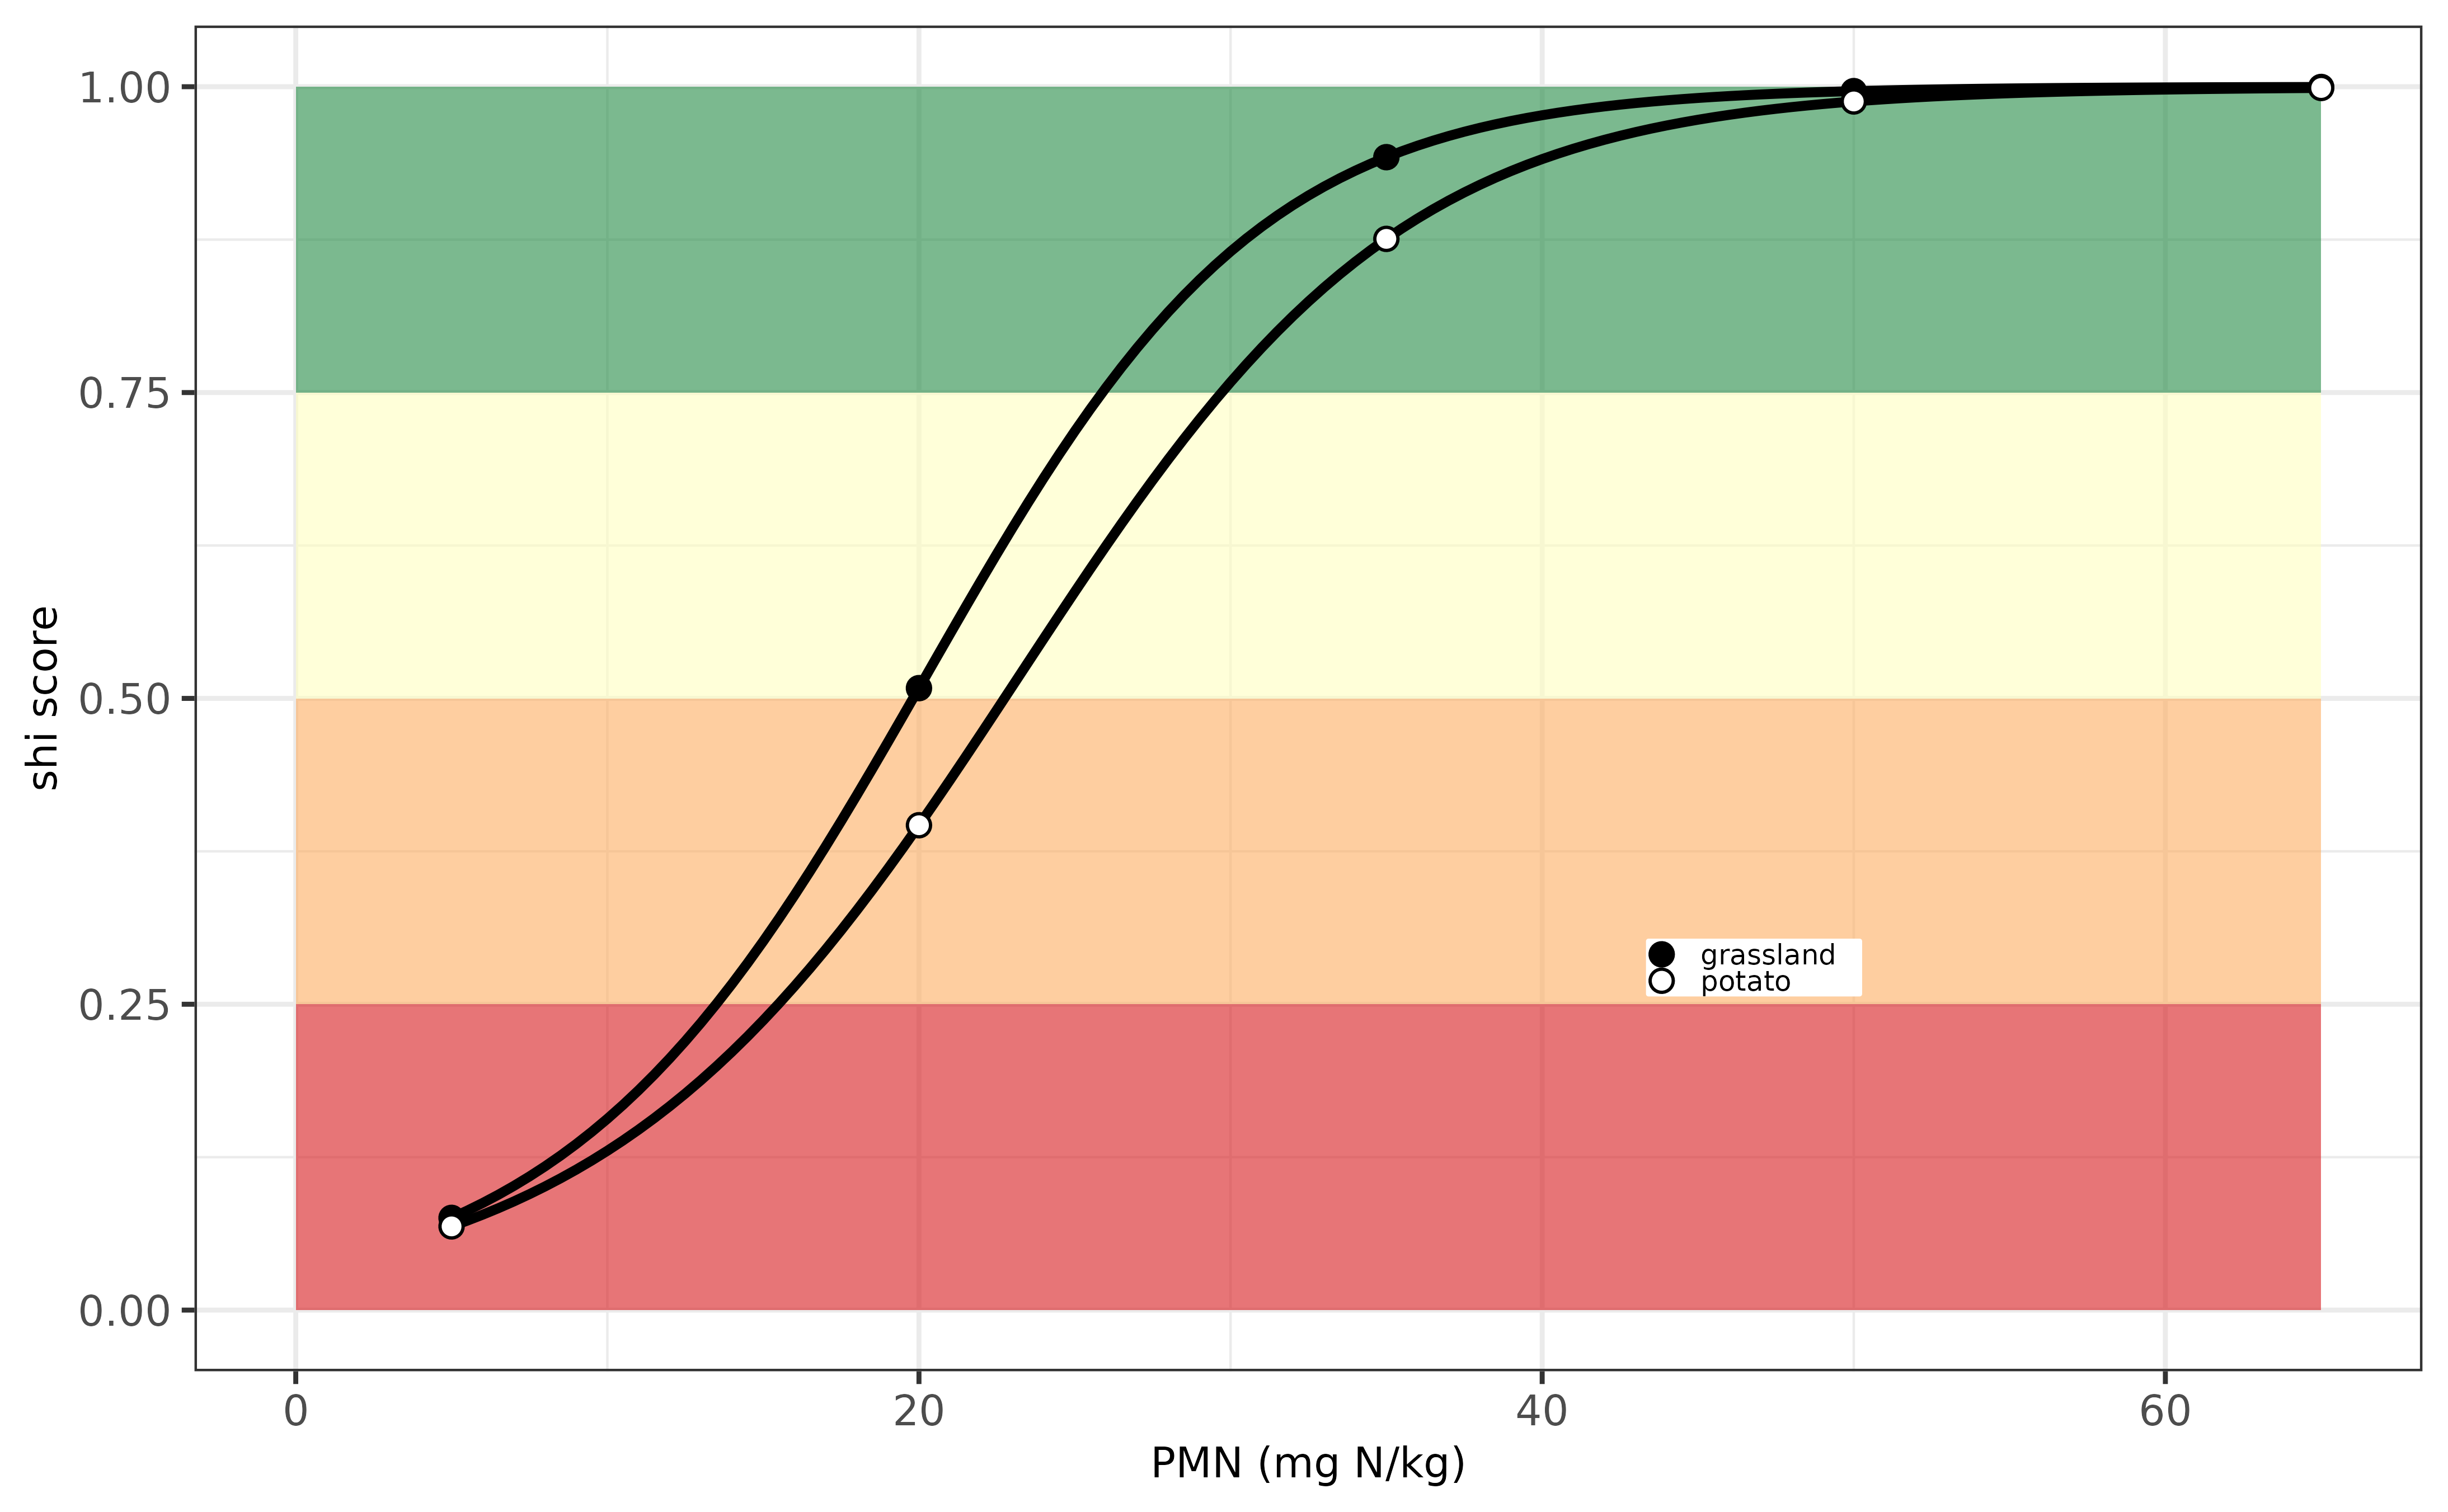
Evaluation PMN-indicator for the Netherlands.
Norway (NO)
There is no country specific assessment for soil nitrogen yet, and the European assessment is applied.
Poland (PL)
There is no country specific assessment for soil nitrogen yet, and the European assessment is applied.
Sweden (SE)
There is no country specific assessment for soil nitrogen yet, and the European assessment is applied.
Slovak Republic (SK)
There is no country specific assessment for soil nitrogen yet, and the European assessment is applied.