EU OSI for potassium
Gerard Ros & Elise van Eynde
2025-12-12
eu_osi_for_potassium.RmdIntroduction
Potassium (K) is a vital macronutrient for both soil health and plant nutrition. In soil, it plays a role in nutrient availability and water retention, while in plants, it’s crucial for numerous physiological processes, impacting growth, development, and overall health. Potassium is one of the 16 plant essential nutrients and is responsible for several critical physiological and metabolic functions of the plant, including photosynthesis, transpiration, water and nutrient translocation, and disease susceptibility through enzyme regulation. Adding sufficient K for plant uptake can provide the host plant with either an advantage or disadvantage in disease susceptibility, depending on the pathogen and the situation.
ffective management of potassium (K) nutrition begins with understanding the amount of plant-available K in the soil solution, how it interacts with other K forms, the potential loss pathways, and any K inputs from organic or inorganic fertilizers. Although K is often considered an immobile nutrient due to its positive charge and attraction to cation exchange sites, its actual mobility and availability depend on whether it is in the soil solution or the exchangeable K pool, as well as the soil’s moisture content.
Potassium in the soil solution is the only mobile and immediately available form for plants, representing roughly 0.02% to 2% of the total soil K. Exchangeable K, while not mobile, can be released from cation exchange sites into the soil solution, making up about 1% to 3% of total K. The vast majority—around 95% to 98%—exists in insoluble forms bound within soil minerals, making it unavailable to plants. Over long periods, weathering gradually releases K from these minerals into more available forms. Certain microorganisms can also enhance K availability from the mineral pool by producing organic acids that solubilize mineral-bound K, increasing its accessibility for plant uptake.
The European Open Soil Index assesses the soil function for K supply using the agronomic knowledge base as being used in the various EU countries. The soil K supply is transformed into an unitless indicator score ranging between zero (poor quality) and one (optimum quality). This indicator score reflects the ‘distance to target’ (i.e. difference between the current and optimum situation, while ensuring that other soil functions are not limiting). The further it deviates from score 1, the poorer the soil function works. An indicator value of 0.5 approximately corresponds to the lower threshold level of the fertilization guidelines under which (additional) fertilization is recommended (given the ‘buildup and maintenance’ approach as being implemented in fertilizer recommendation systems). Overall, the indicator value can be interpreted as good (>0.75), sufficient (0.5-0.75), and poor (<0.5).
The soil K wrapper function
In euosi package has a wrapper function to assess the soil health
index for the soil K supply in agricultural soils across Europe. The
wrapper function is osi_c_potassium and has the following
inputs:
- B_LU (character) The crop code
- B_SOILTYPE_AGR (character) The soil type in a particular region
- B_AER_FR (character) An agroeconomic region in France (optional)
- A_CLAY_MI (numeric) The clay content of the soil (%)
- A_SAND_MI (numeric) The sand content of the soil (%)
- A_SOM_LOI (numeric) The organic matter content of the soil (%)
- A_C_OF (numeric) The organic carbon content in the soil (g C / kg). Optional.
- A_PH_CC (numeric) The pH measured in CaCl2 extraction.
- A_PH_WA (numeric) The pH measured in water. Optional.
- A_CACO3_IF (numeric) the percentage of CaCO3 (%)
- A_CEC_CO (numeric) The cation exchange capacity, analyzed via cobalt-hexamine extraction (mmol+ / kg)
- A_K_AAA (numeric) The exchangeable K-content measured via ammonium acetate extraction (mg K / kg)
- A_K_AL (numeric) The exchangeable K-content measured via Ammonium Lactate extracton (mg K/ kg)
- A_K_AN (numeric) The K-content extracted with ammonium nitrate (mg K /kg)
- A_K_CAL (numeric) The exchangeable K-content measured via Calcium Ammonium Lactate (mg K/ kg)
- A_K_CC (numeric) The plant available potassium, extracted with 0.01M CaCl2 (mg / kg),
- A_K_CO_PO (numeric) The occupation of the CEC with potassium (%)
- A_K_DL (numeric) The exchangeable K-content measured via Double Lactate extraction (mg K/ kg)
- A_K_M3 (numeric) The exchangeable K-content measured via Mehlich 3 extracton (mg K/ kg)
- A_K_NaAAA (numeric) The K-content extracted with Morgan’s solution, sodium acetate acetic acid (mg/ kg)
- A_K_WA (numeric) The exchangeable K-content measured via water extracton (mg K/ kg)
- B_COUNTRY (character) The country code
Not all the inputs are mandatory. The function runs with the soil
parameters being available for LUCAS. Other soil K extraction methods
can be added, but when unknown, then these are estimated from K-AAA
using published pedotransferfunctions, using the function
osi_conv_potassium. Similarly, helper functions are applied
to estimate A_C_OF,A_PH_WA, and
A_CEC_CO when value is missing (i.e. NA_real_).
Note that the IACS crop codes codes have been added to the
osi_crops package table from version 0.4.0 onwards. The
crop codes are only present for the countries AT, BE, BG, CZ, DE, DK,
ES, FI, FR, IT, NL, PT, SE, and SK.
The wrapper function wraps country specific K assessment functions. These are illustrated and described in this vignette per country, sorted alphabetically.
Austria (AT)
The potassium supply in view of soil health can be calculated using
osi_c_potassium_at using the following inputs:
- B_LU, being the crop code, an unique number for each crop
- A_K_CAL, being the extracted K content with calcium ammonium lactate, unit mg K /kg.
- B_TEXTURE_HYPRES, being the soil texture class according to HYPRES classification system
The K supplying capacity differs in soils with varying textures.
Based on the soil mineralogy (clay, sand and silt content) one can
easily classify the HYPRES texture class using
osi_get_TEXTURE_HYPRES.
The soil K threshold for optimum soil health is in Austria generic
for all soil types but differs between arable land and grassland. The
optimum threshold is set around 47-68 mg K/kg for grassland and around
47-111 mg K/kg for cropland. More information can be found in the
article of Bohner et al. (2013), that can be downloaded here
with a reference to the publication entitled
RICHTLINIEN FÜR DIE SACHGERECHTE DÜNGUNG, 2006: Anleitung zur Interpretation von Bodenuntersuchungsergebnissen in der Landwirtschaft. 6. Aufl. Bundesministerium für Land- und Forstwirtschaft, Umwelt und Wasserwirtschaft, 80 S
that can be found here.
Note that the IACS crop codes codes have been added to the
osi_crops package table in version 0.4.0.
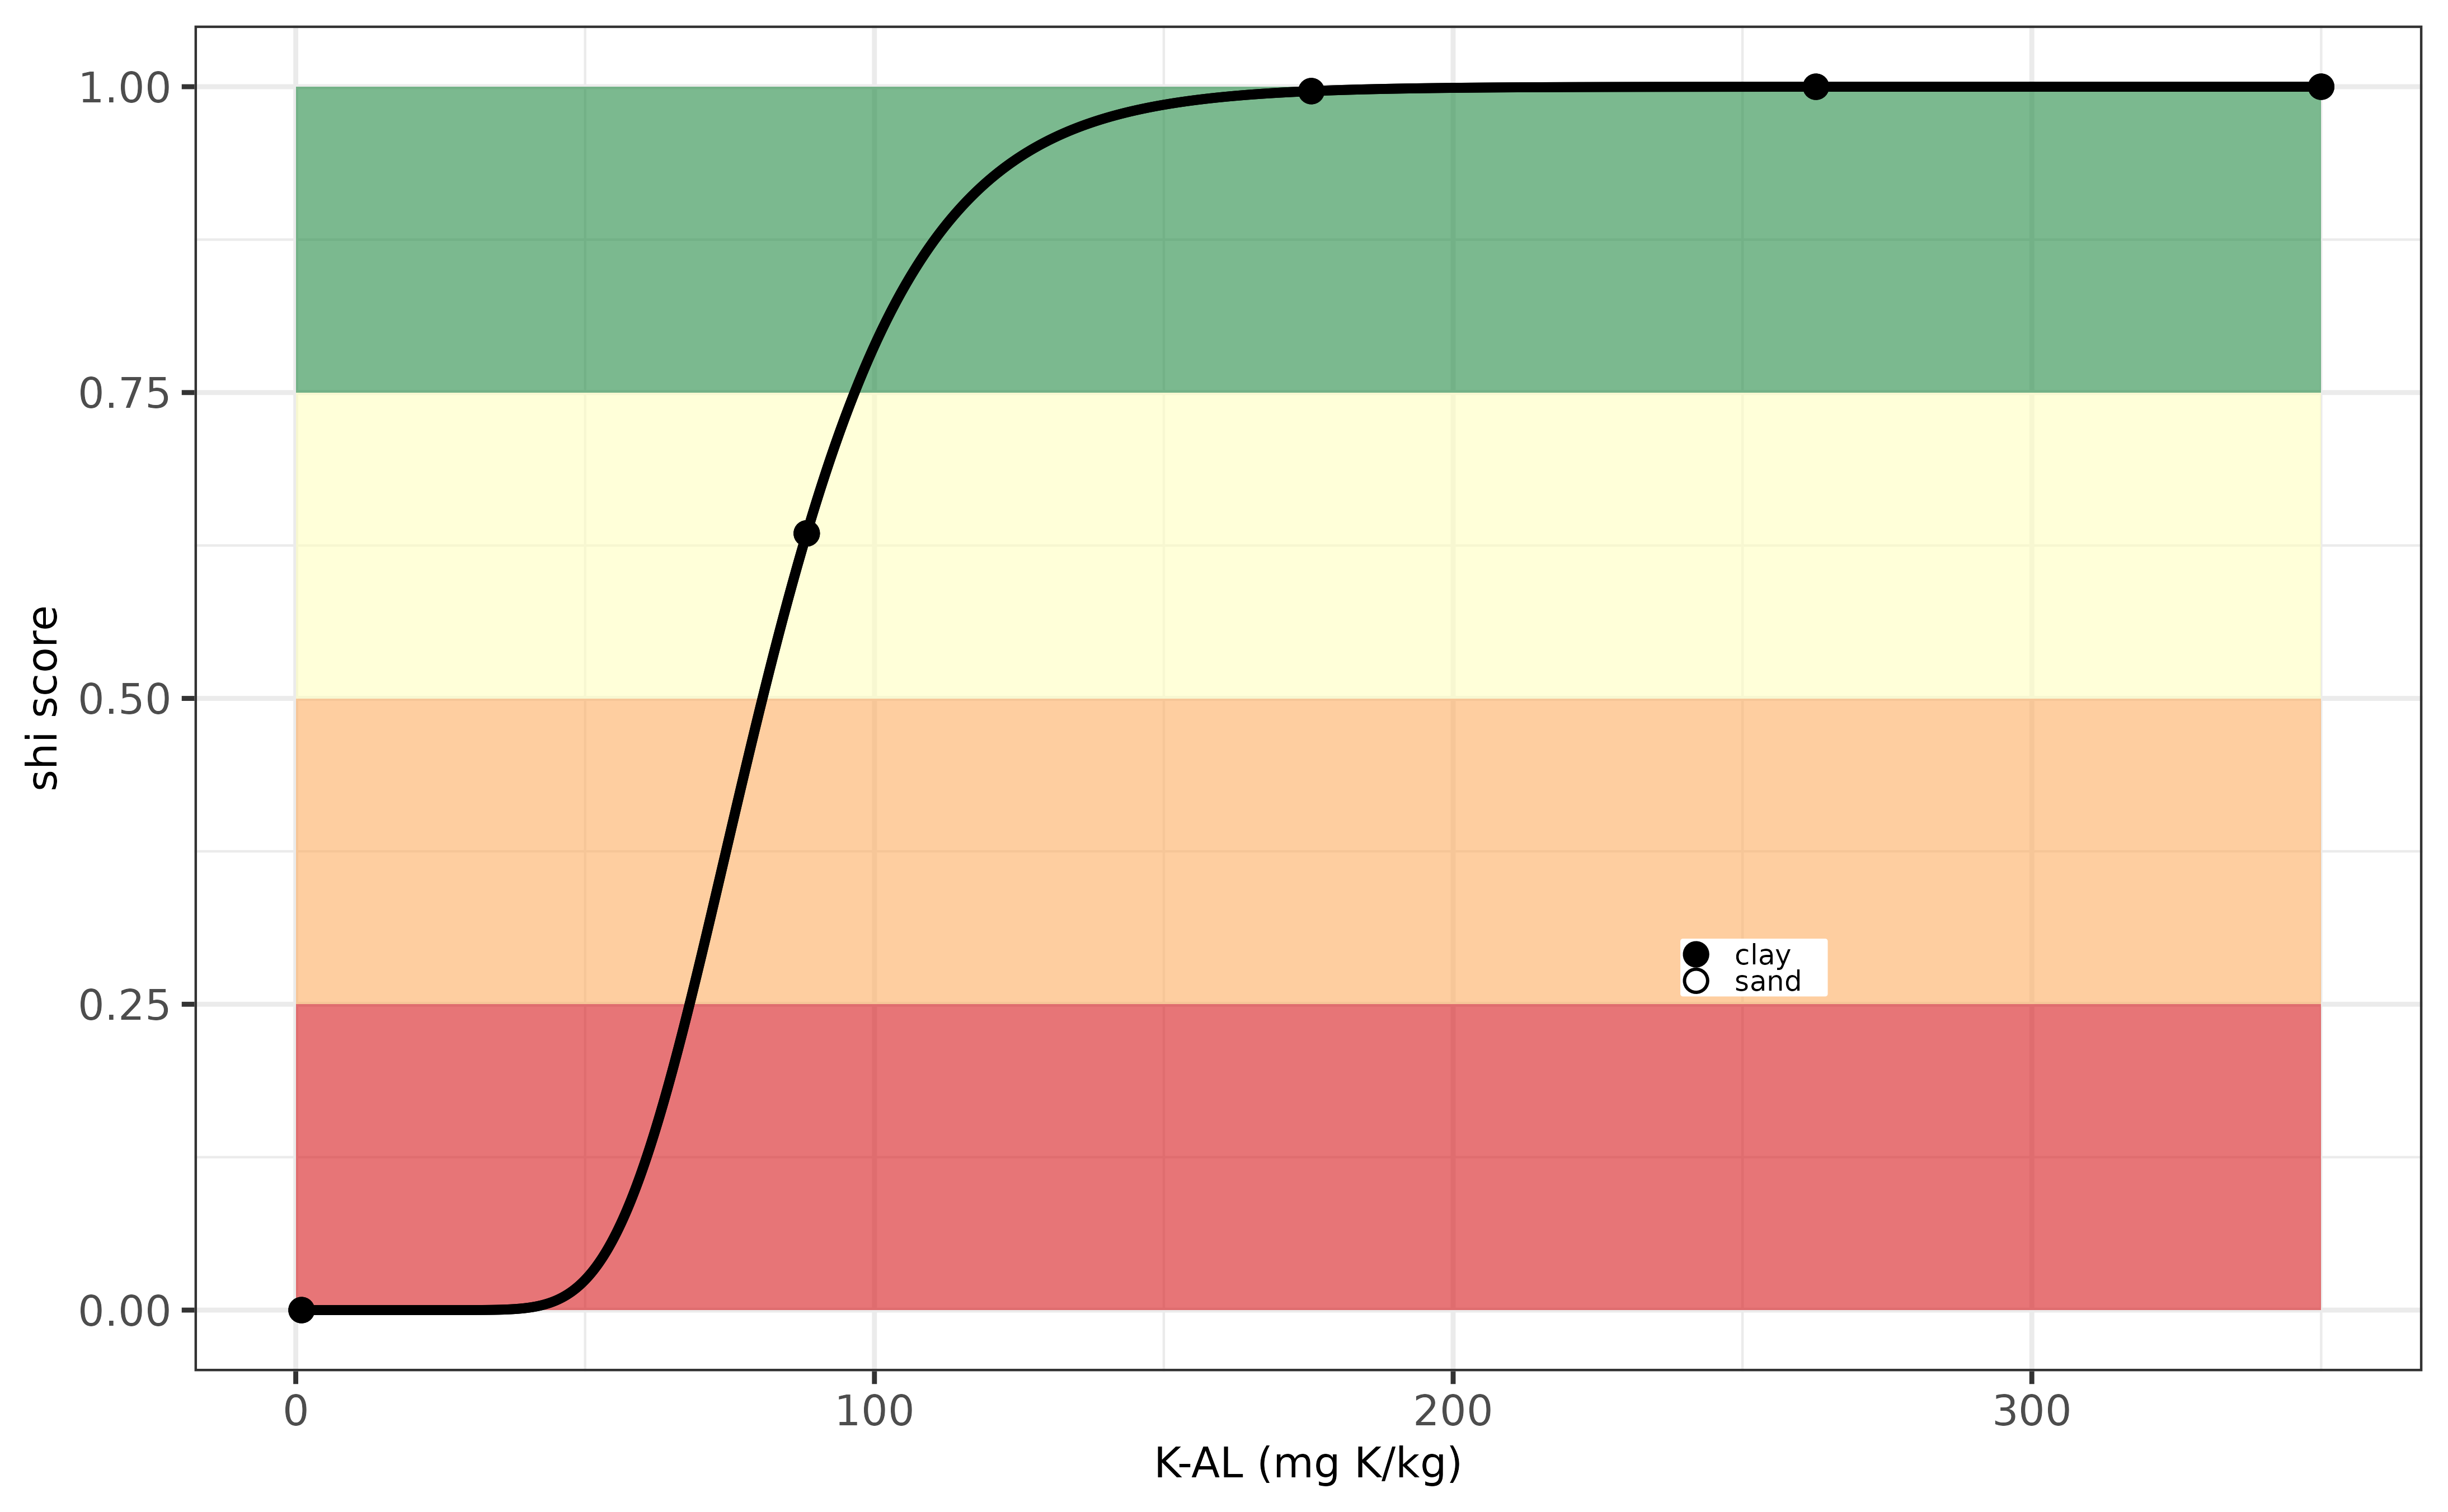
The optimum soil K threshold is around 150 mg K/kg whereas occurance of K deficiencies might vary depending on soil type. Potassium deficiency symptoms start to occur when the K-CAL becomes lower than 100 mg K/kg for the clay soils and lower than 50 mg K/kg fr the sand soils.
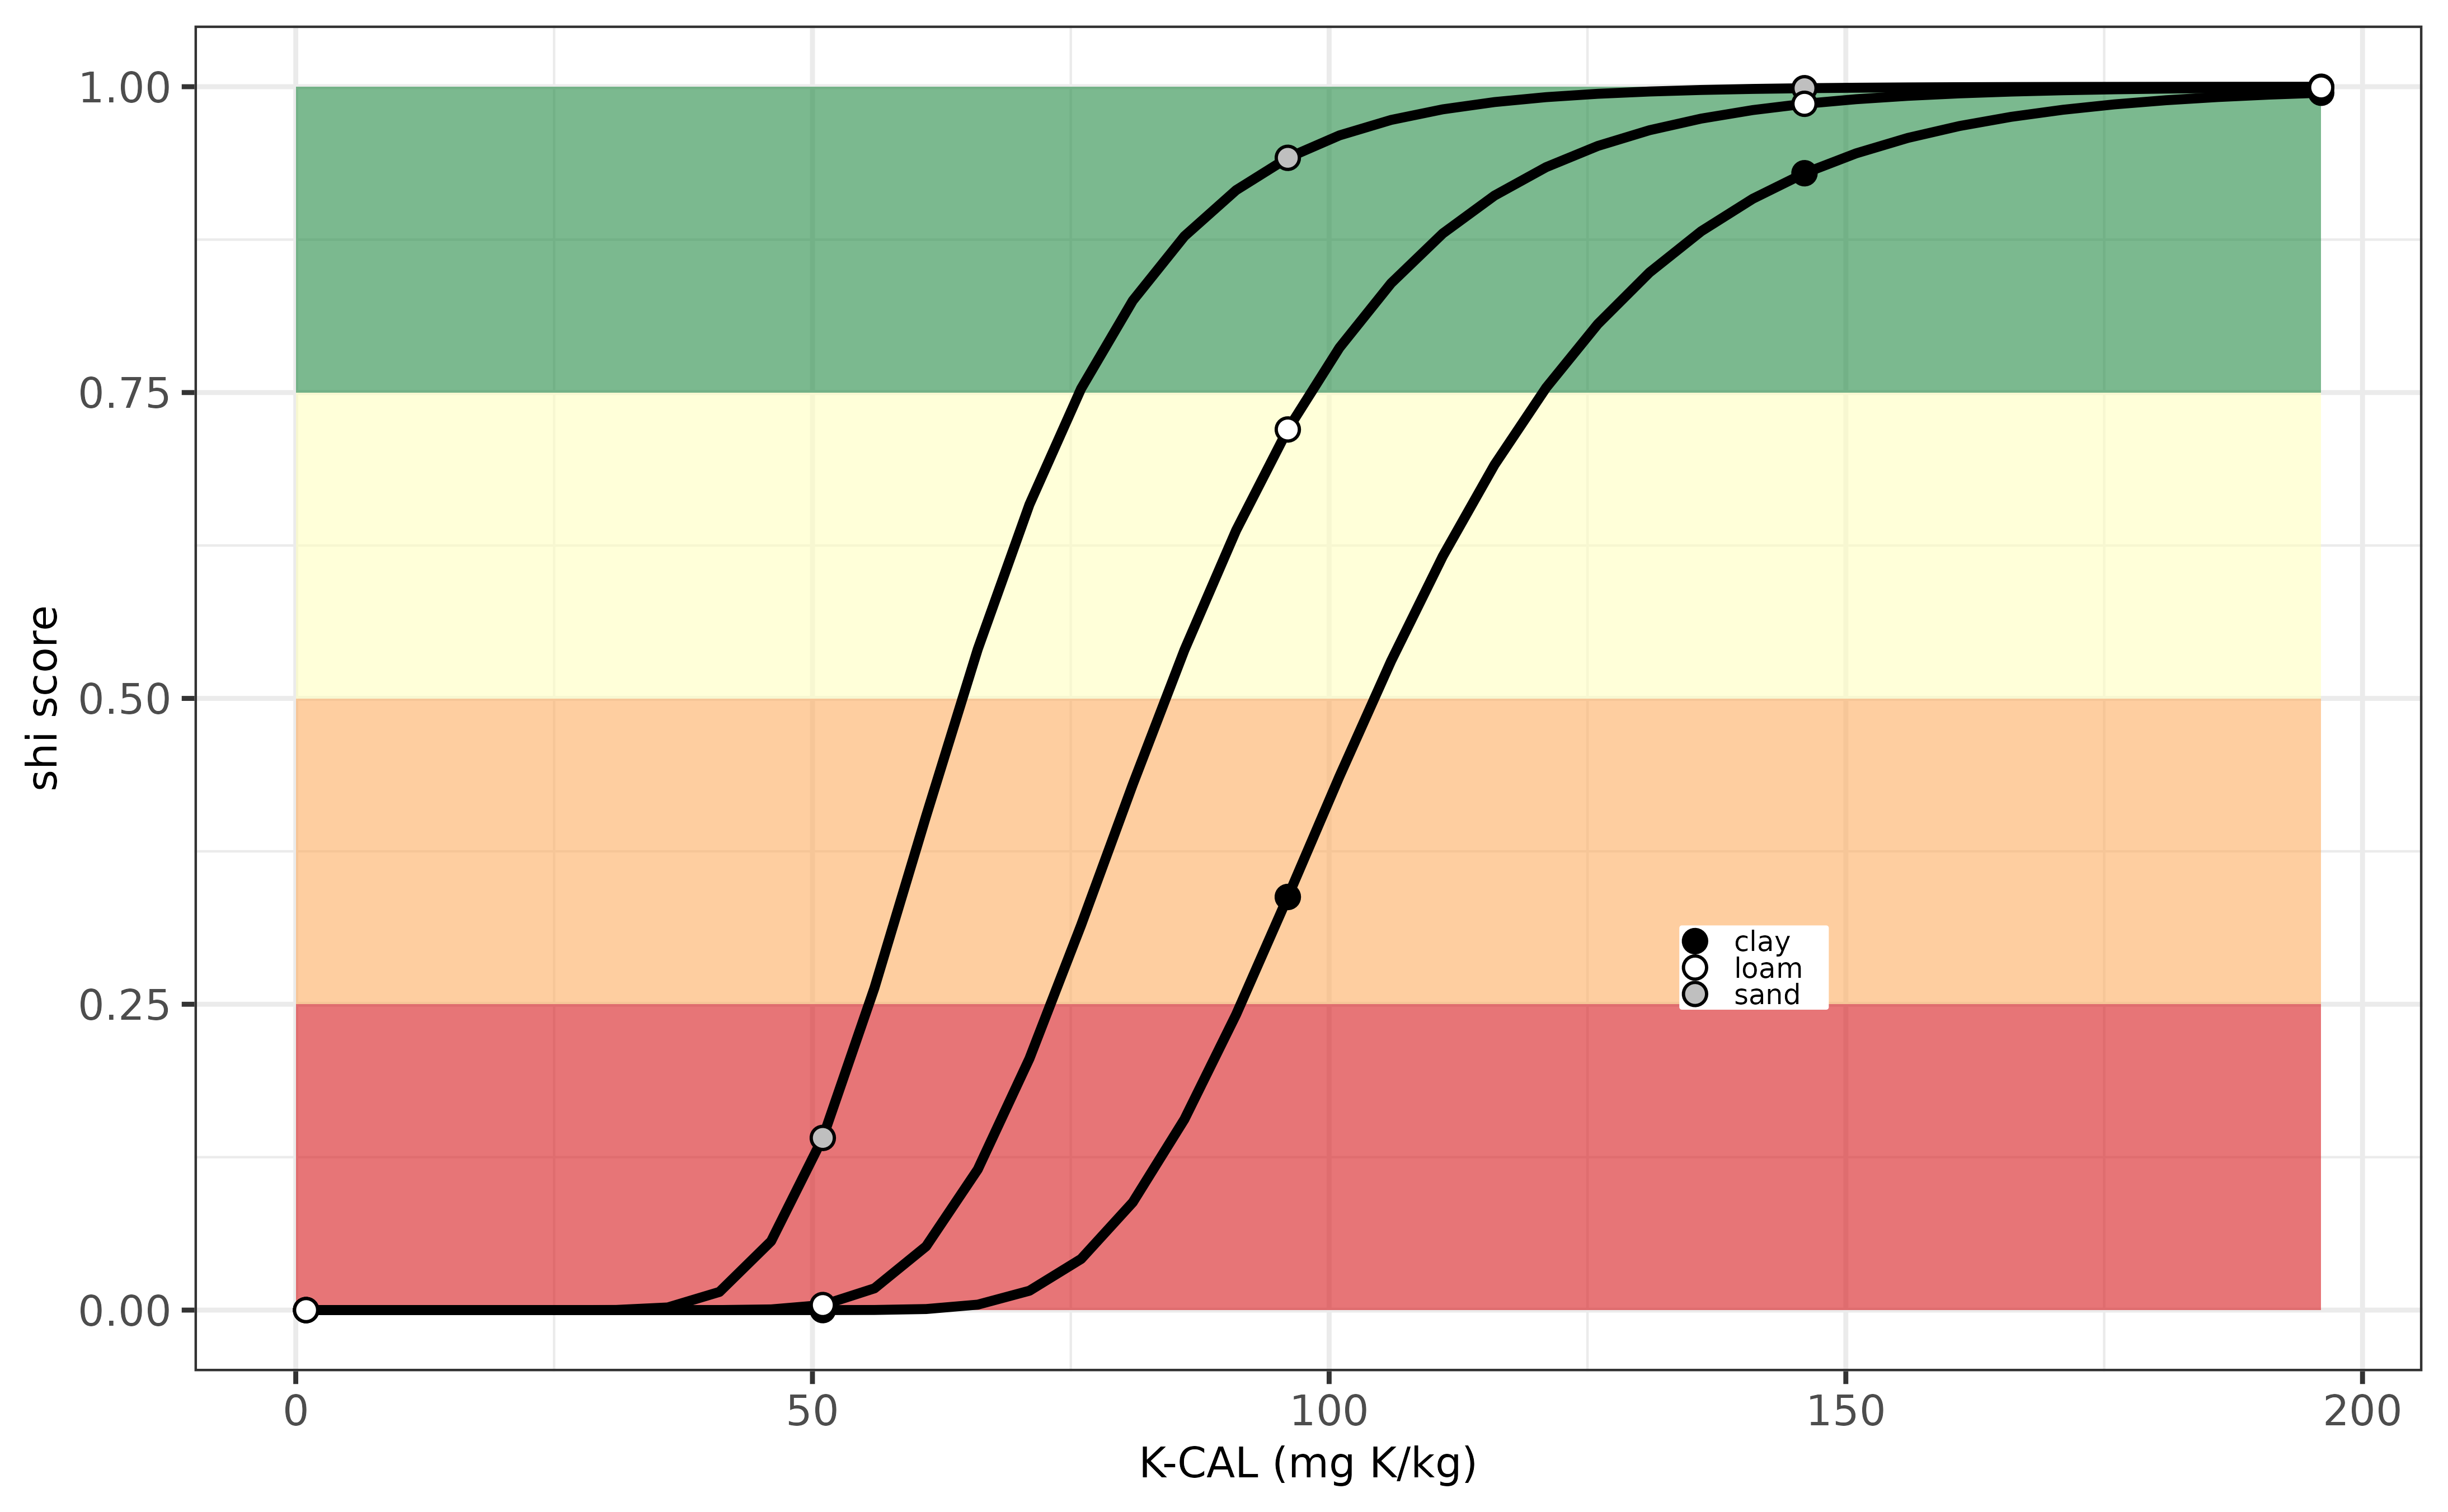
Evaluation K-indicator for Austria.
Belgium (Flanders)
The potassium supply in Belgium is based on the K level in soil being
extracted with acid ammonium acetate There is also a distinction between
cropland or grassland with a higher optimum threshold value for
grassland than cropland. Also soil type affects the K supply. More
information of the optimum threshold values and the soil K status
evaluation can be found in the IFA report entitled
POTASSIUM AND MAGNESIUM FERTILISER RECOMMENDATIONS IN SOME EUROPEAN COUNTRIES.
In the euosi package the soil health score for K supply can be
calculated with osi_c_potassium_be, requiring the following
inputs:
- B_LU, being the Belgium crop code, an unique number for each crop
- A_K_AAA, being the extracted K content with ammonium acetate, unit mg K /kg.
- B_TEXTURE_BE, being the soil texture class according to Belgium classification system
An example is illustrated below for a sugar beet crop (crop code 91) and a grassland (code = 60) for a single sandy soil with K-content of 85 mg K/kg:
# show an example for sugar beet crop (code = 91) and grassland (code = 60)
c(osi_c_potassium_be(B_LU = '91', A_K_AAA = 95, B_TEXTURE_BE = 'S'),
  osi_c_potassium_be(B_LU = '60', A_K_AAA = 95, B_TEXTURE_BE = 'S'))
## [1] 0.6387632 0.6791787Below the same example but then visualised for a series of soils with a K-AAA value ranging from 0 to 200 mg K per kg for two soils (S = sand, P = loam) and land use grassland. From this example one can see that the soil health index score varies from very low to very high, depending on the content of K-AAA (mg K/kg), and deficiency symptions will occur when K-AAA values decrease below 80-100 mg K/kg.
Evaluation K-indicator for the Belgium.
Switzerland (CH)
The potassium supply in view of soil health for agricultural soils in
Switzerland can be calculated using osi_c_potassium_ch
using the following inputs:
- B_LU, being the crop code, an unique number for each crop
- A_K_AAA, being the extracted K content with ammonium acetate, unit mg K /kg.
- A_CLAY_MI, being the clay content, in units percentage (%)
More information can be found in Flisch et al. (2017) entitled
Grundlagen für die Düngung landwirtschaftlicher Kulturen in der Schweiz.
This document can be downloaded here.
Note that the crop codes are not yet available in
osi_crops package table.
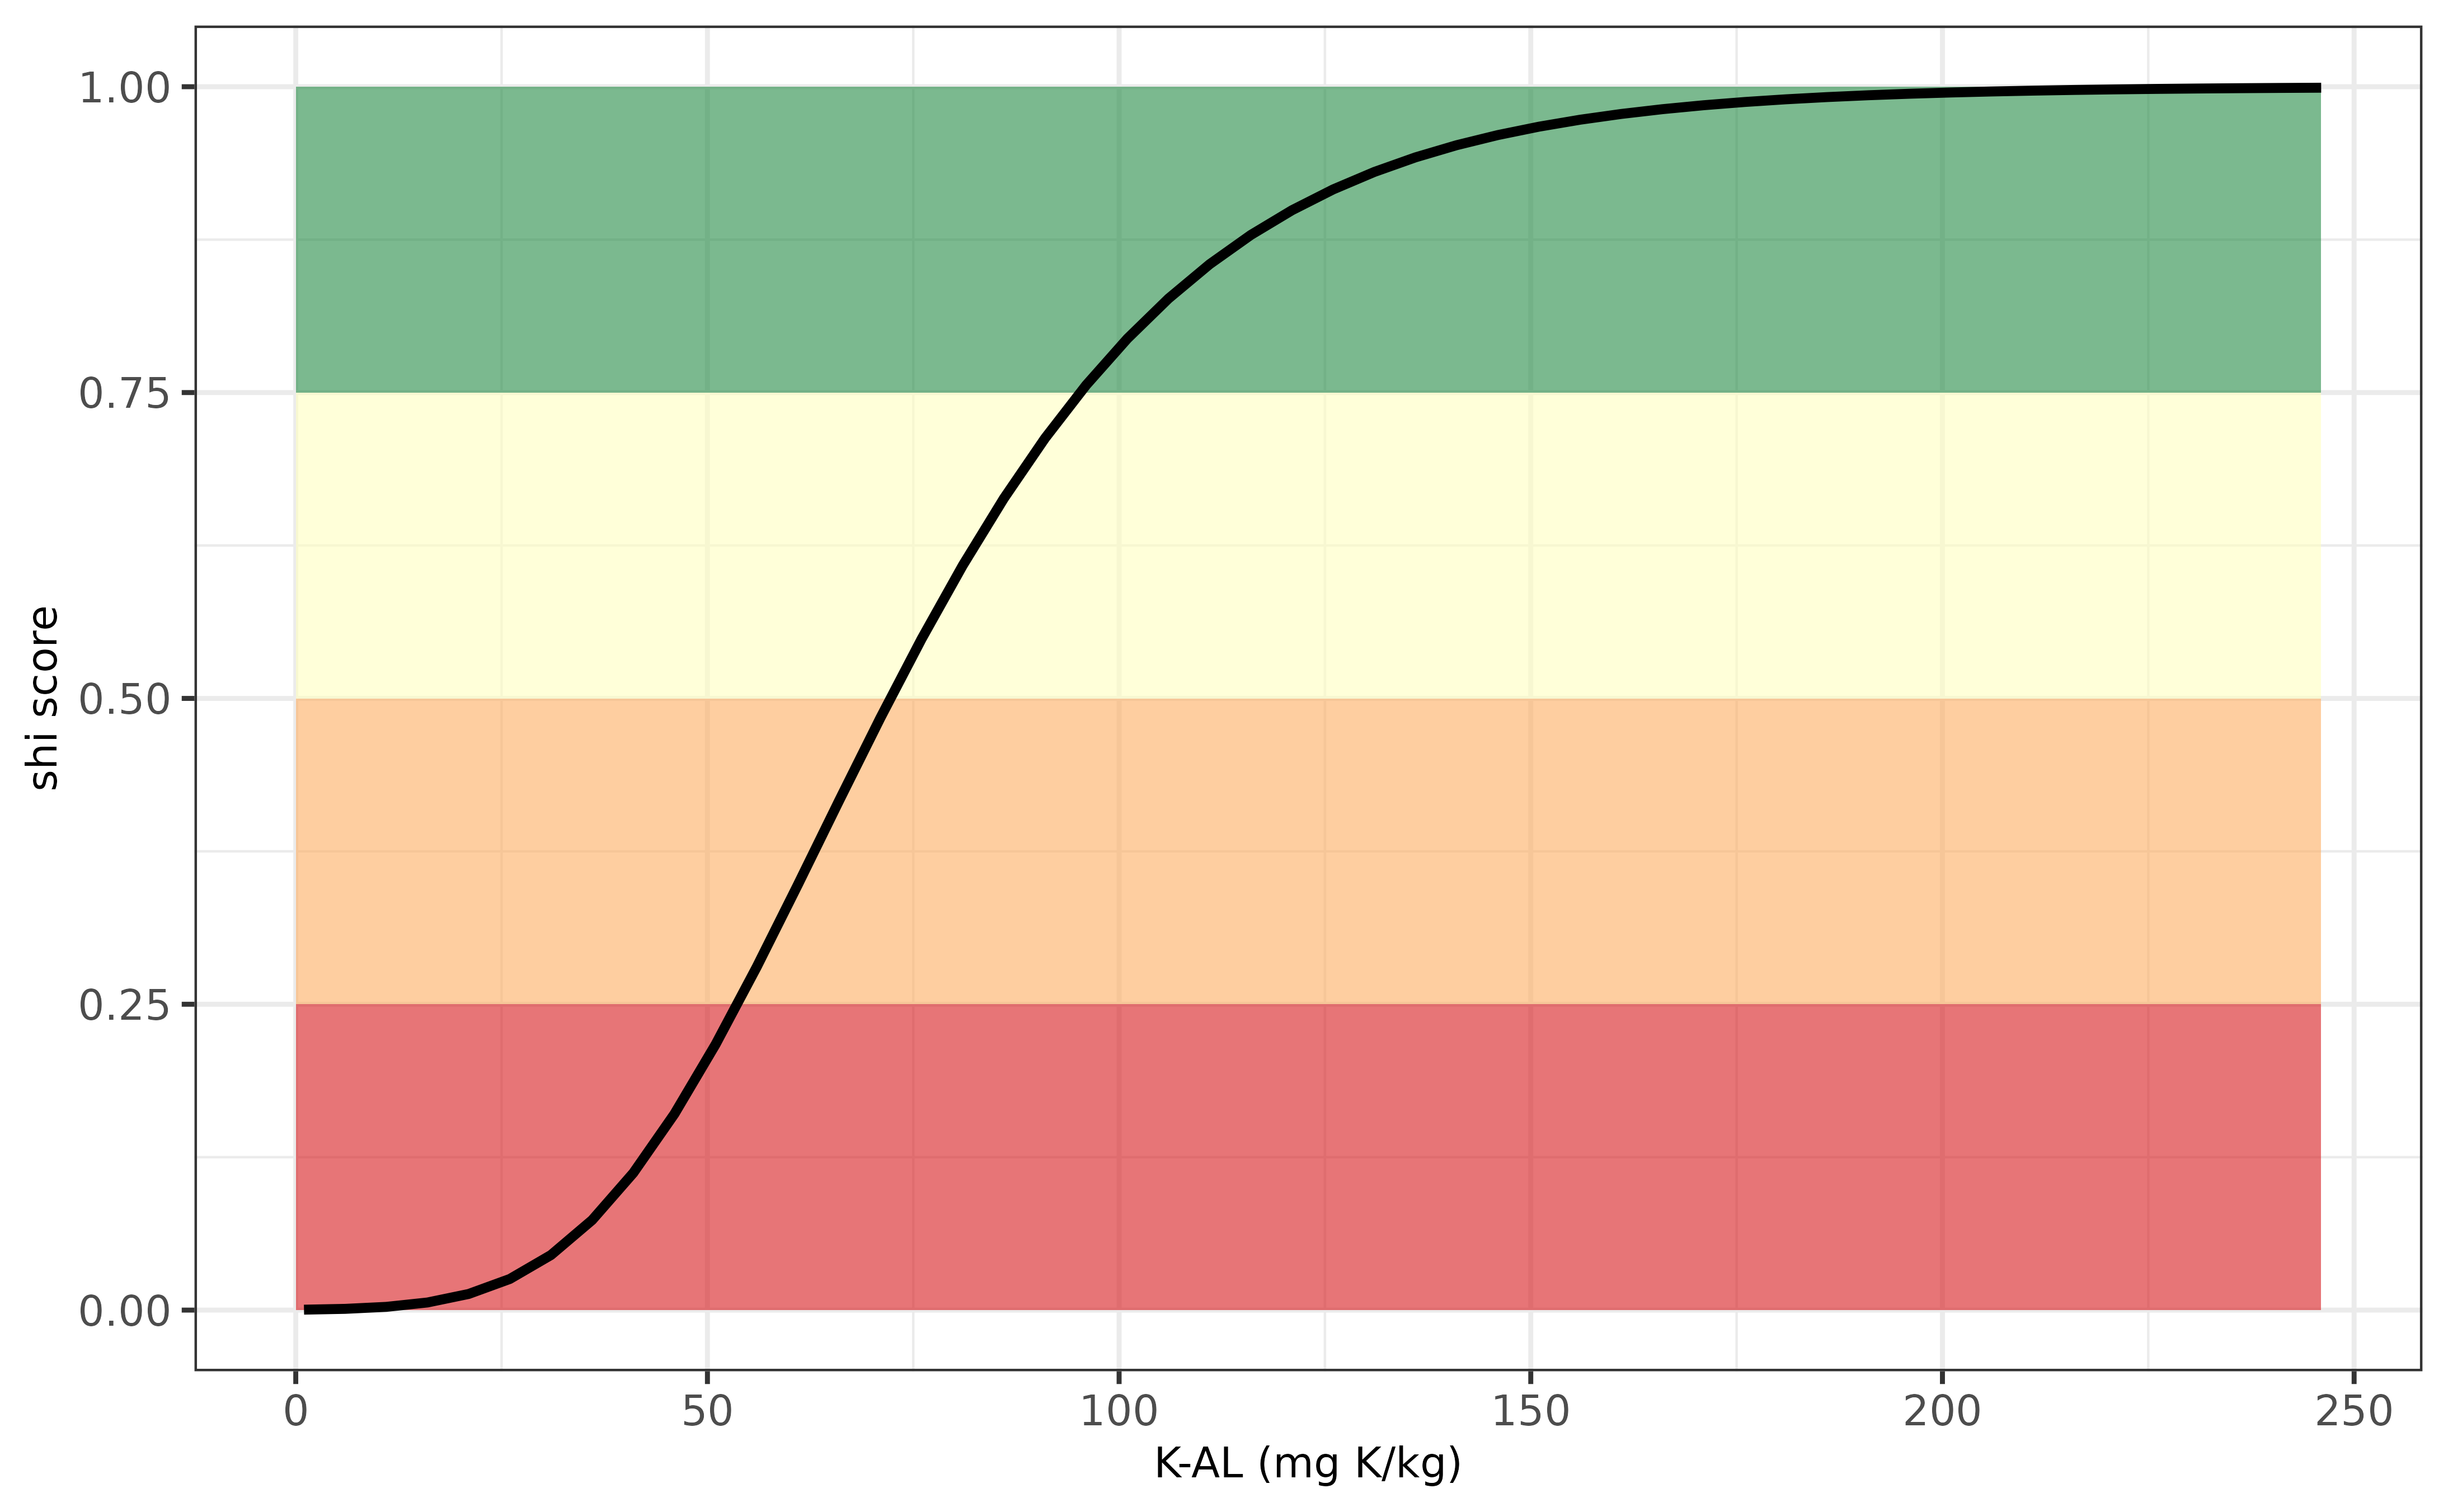
Below an example is visualized how the soil health index varies in relation to variation in K-AAA. The optimum soil K threshold value for sustainable crop production is around 150 mg K/ kg, and the soil index shows that K deficiency might occur when K-AAA values decreases down to 60 mg K/kg.
Evaluation K-indicator for Switzerland.
Czech Republic (CZ)
The potassium supply in view of soil health for agricultural soils in
Czech Republic can be calculated using osi_c_potassium_cz
using the following inputs:
- B_LU, being the crop code, an unique number for each crop
- A_K_M3, being the extracted K content with Mehlich-III, unit mg K /kg
- B_TEXTURE_HYPRES, being the soil texture class according to HYPRES classification system
The K supplying capacity differs in soils with varying textures.
Based on the soil mineralogy (clay, sand and silt content) one can
easily classify the HYPRES texture class using
osi_get_TEXTURE_HYPRES.
Information on the threshold values for K-Mehlich in view of sustainable crop production has been derived from Fotyma et al. (2008) who wrote a comprehensive overview of soil testing methods in Eastern Europe entitled “Soil testing methods and fertilizer recommendations in Central–Eastern European countries”.
Note that the IACS crop codes codes have been added to the
osi_crops package table in version 0.4.0.
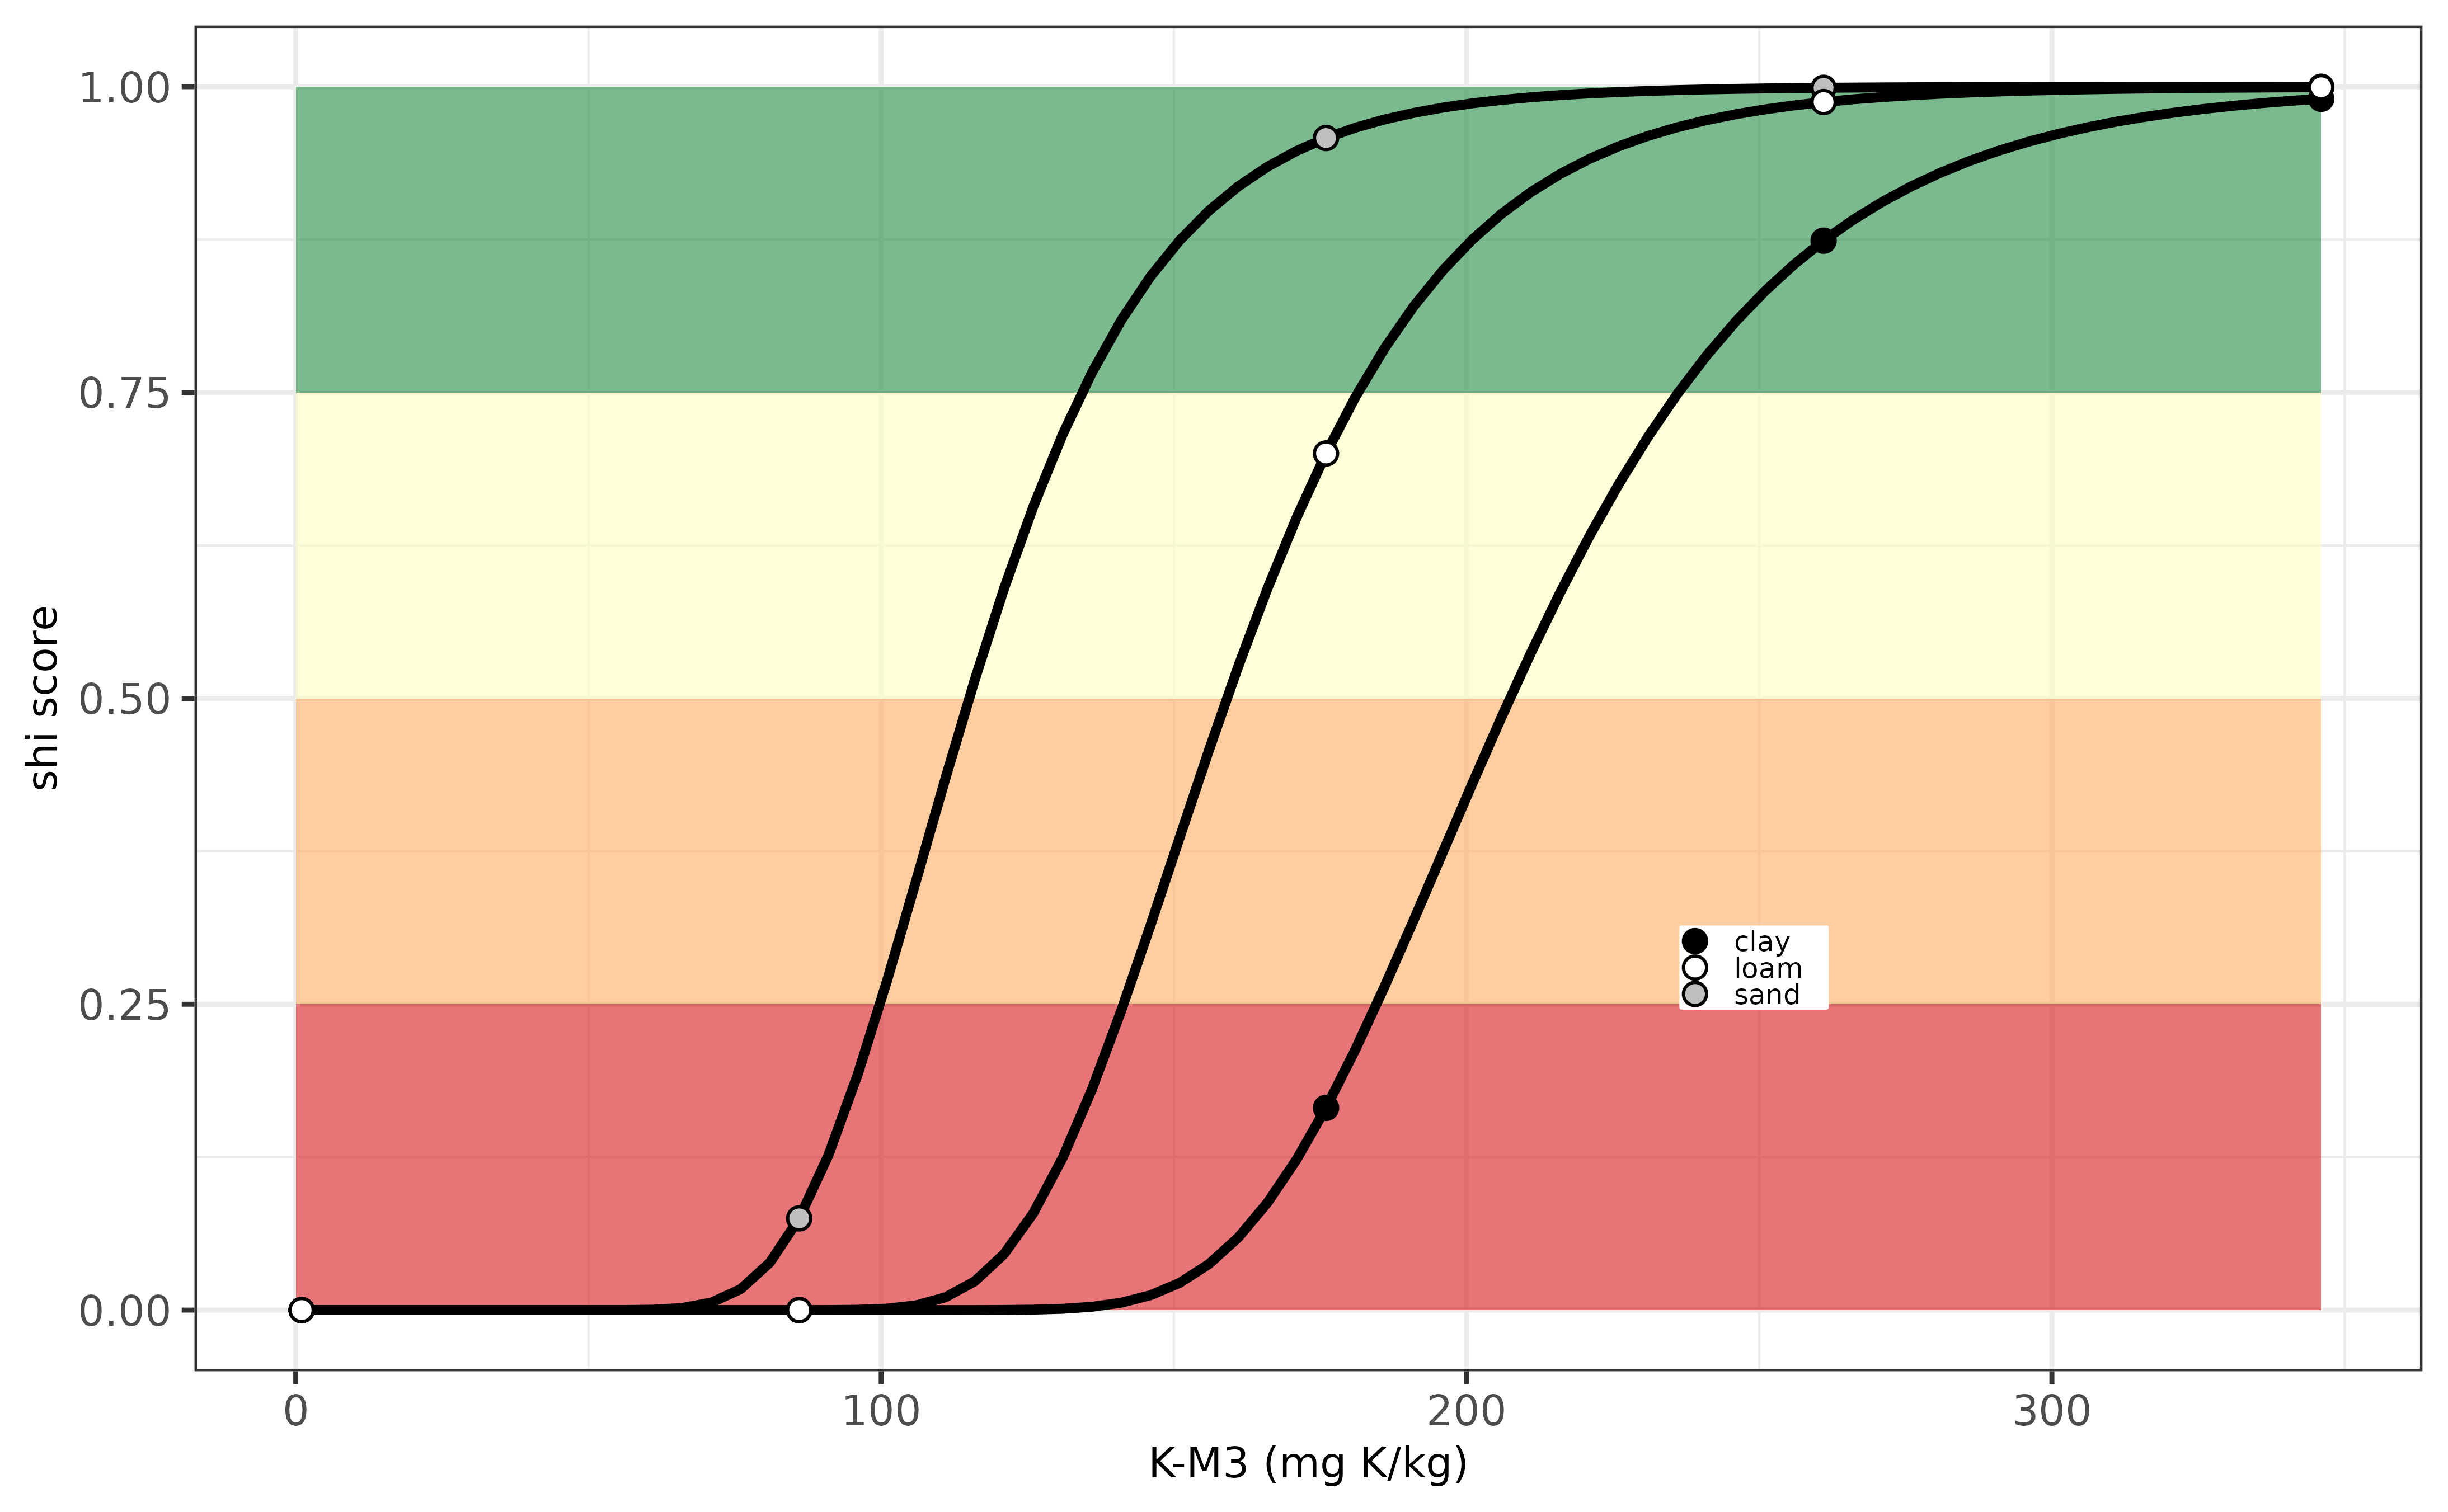
Below an example is visualized how the soil health index varies in relation to variation in K Mehlich-III. The optimum soil K threshold value for sustainable crop production is around 200 mg K/ kg for the loam and sand soil, and lies around 350 mg K/kg for the clay soils. The soil index shows K deficiency when K Mehlich-III values decreases down to 100 mg K/kg for the sand and loam soil, and down to 180 mg K/kg for the clay soil.
Evaluation K-indicator for Czech Republic.
Germany (DE)
The potassium supply in view of soil health for agricultural soils in
Germany can be calculated using osi_c_potassium_de using
the following inputs:
- B_LU, being the crop code, an unique number for each crop
- A_C_OF, being the soil organic carbon content (g C/ kg)
- A_CLAY_MI, being the clay content, in units percentage (%)
- A_SAND_MI, being the sand content, in units percentage (%)
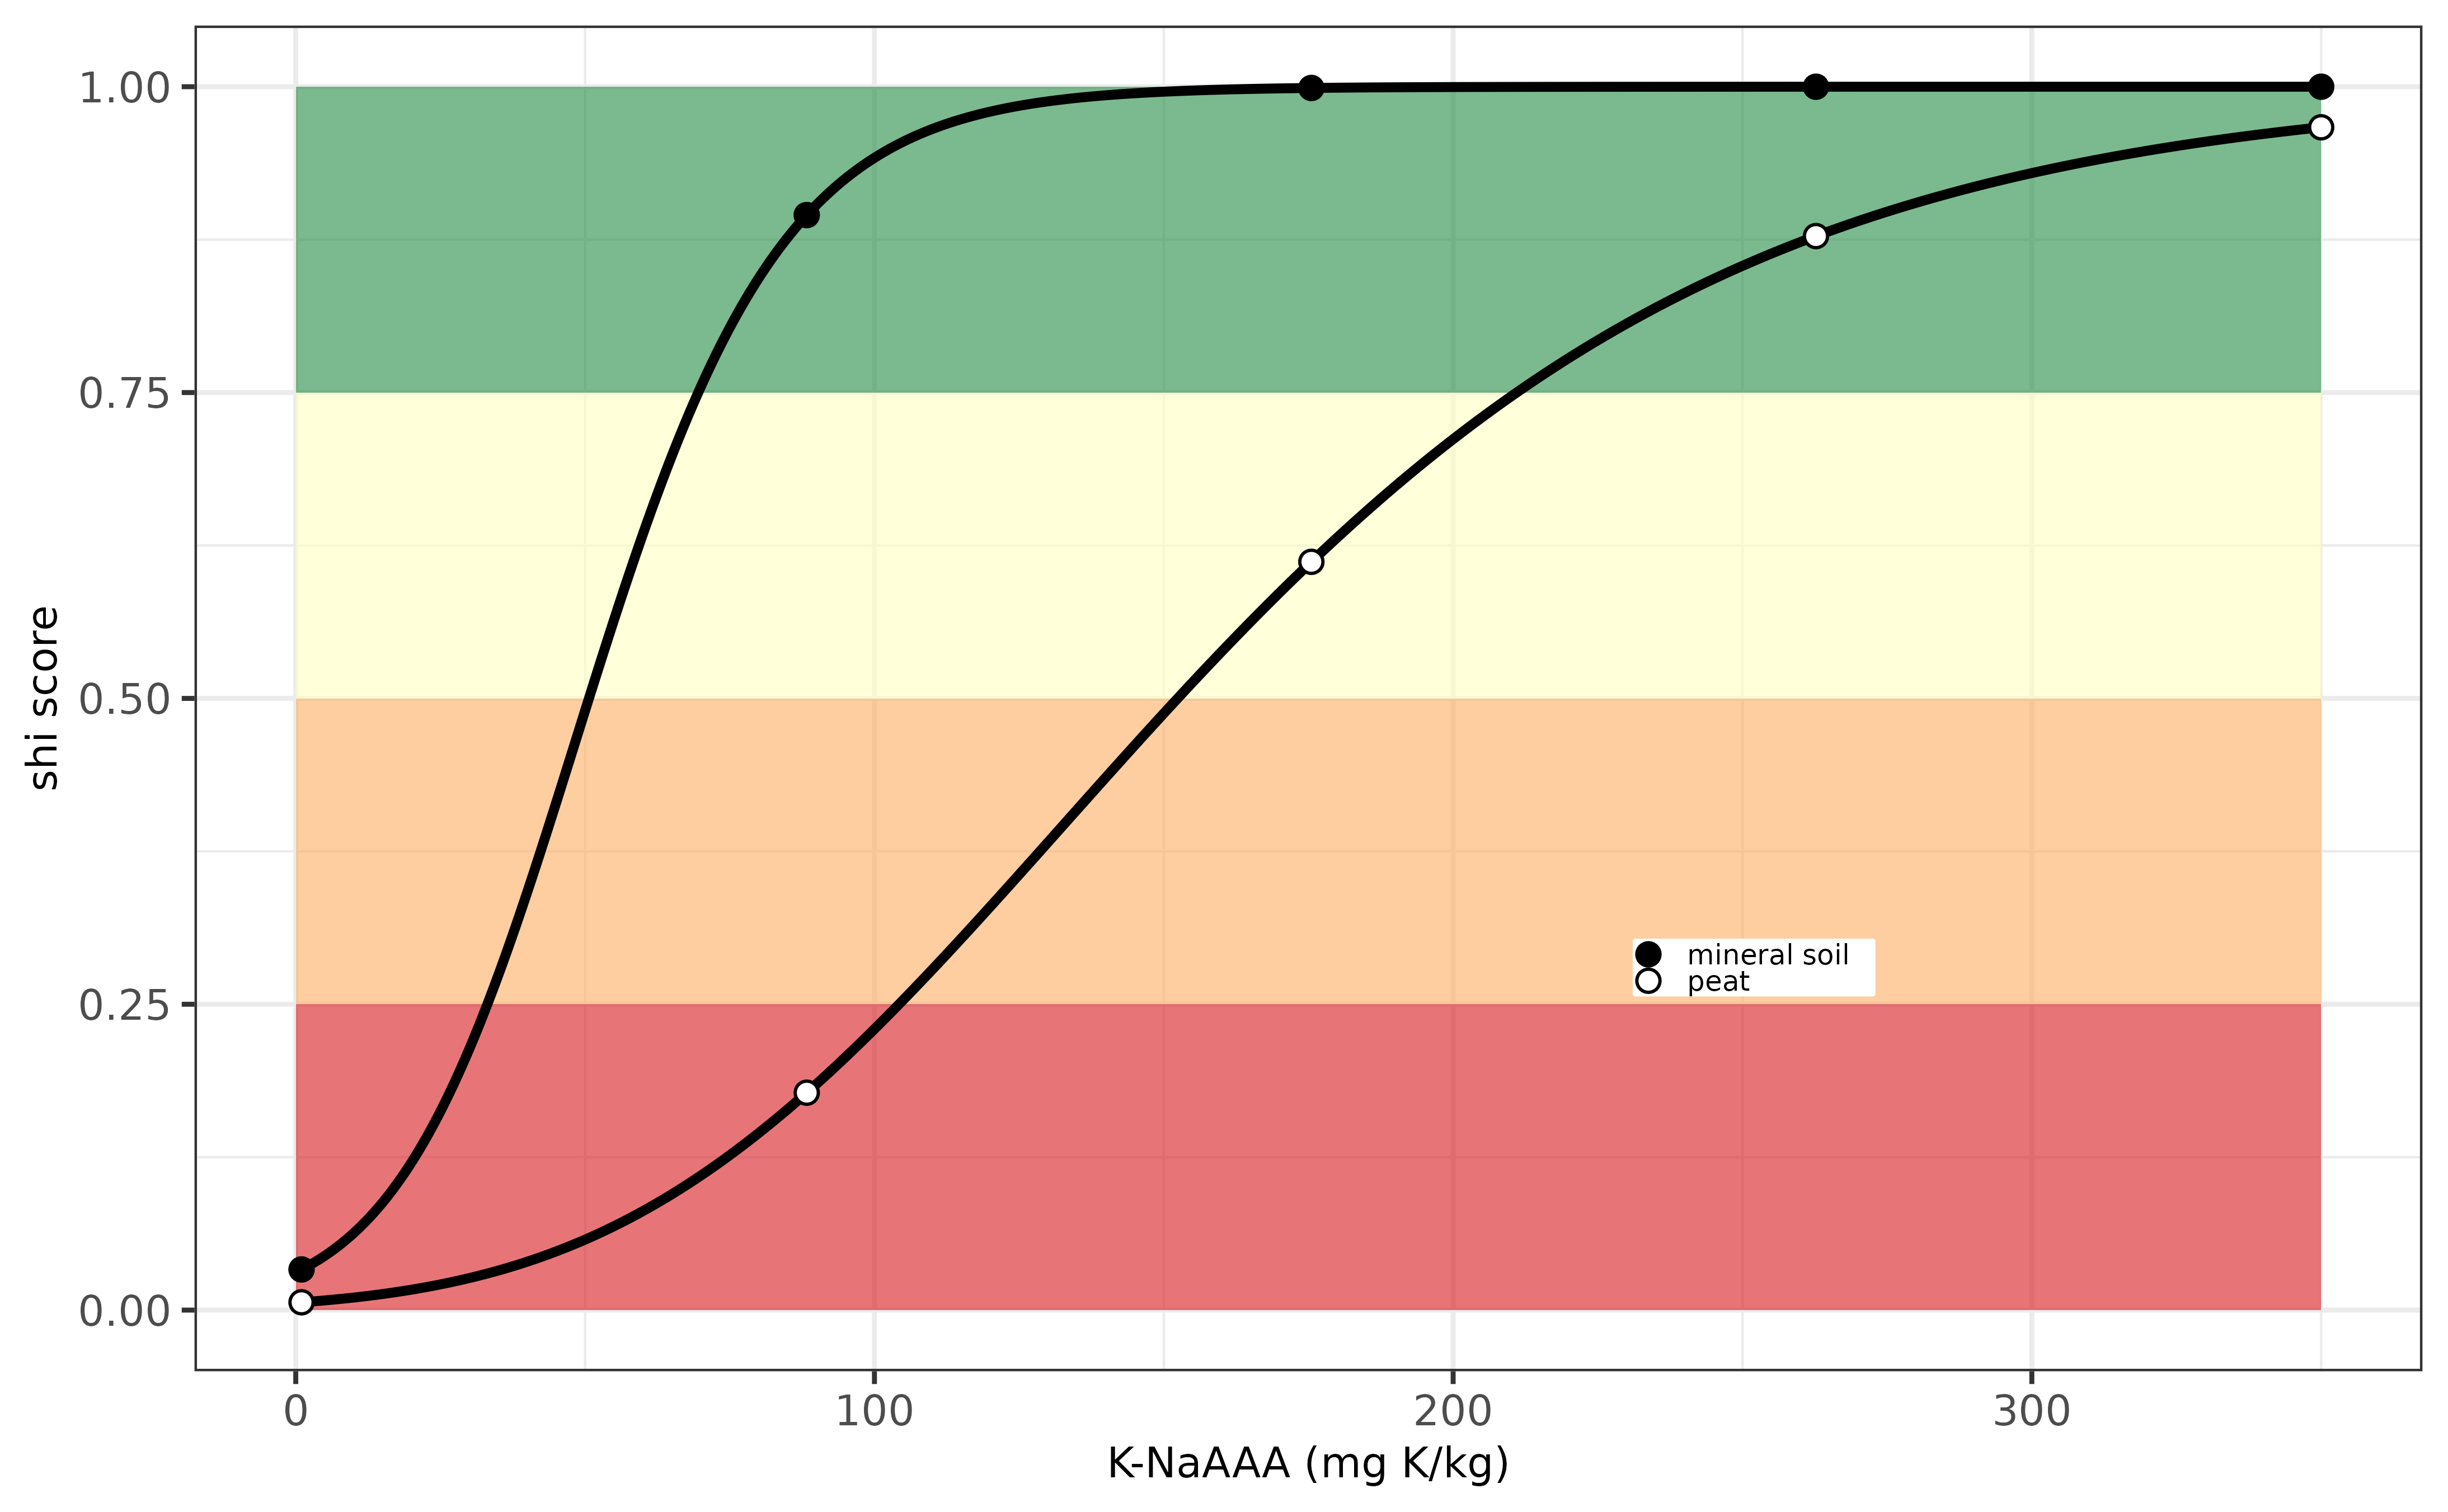
- A_K_CAL, being the extracted K content with calcium ammonium lactate, unit mg K /kg (internally converted to the common unit mg K /100g for mineral soils and mg K/100 ml for peat soils, as being used in German fertilizer recommendation systems).
The K supplying capacity differ for soils varying in clay content and distinghuises also between peaty and mineral soils, as well land use (i.e. grassland versus cropland). Information on the threshold values for K-CAL in view of sustainable crop production has been derived by the VDLUFA. For more information, see here
Note that the IACS crop codes for Germany are available in
osi_crops package table.
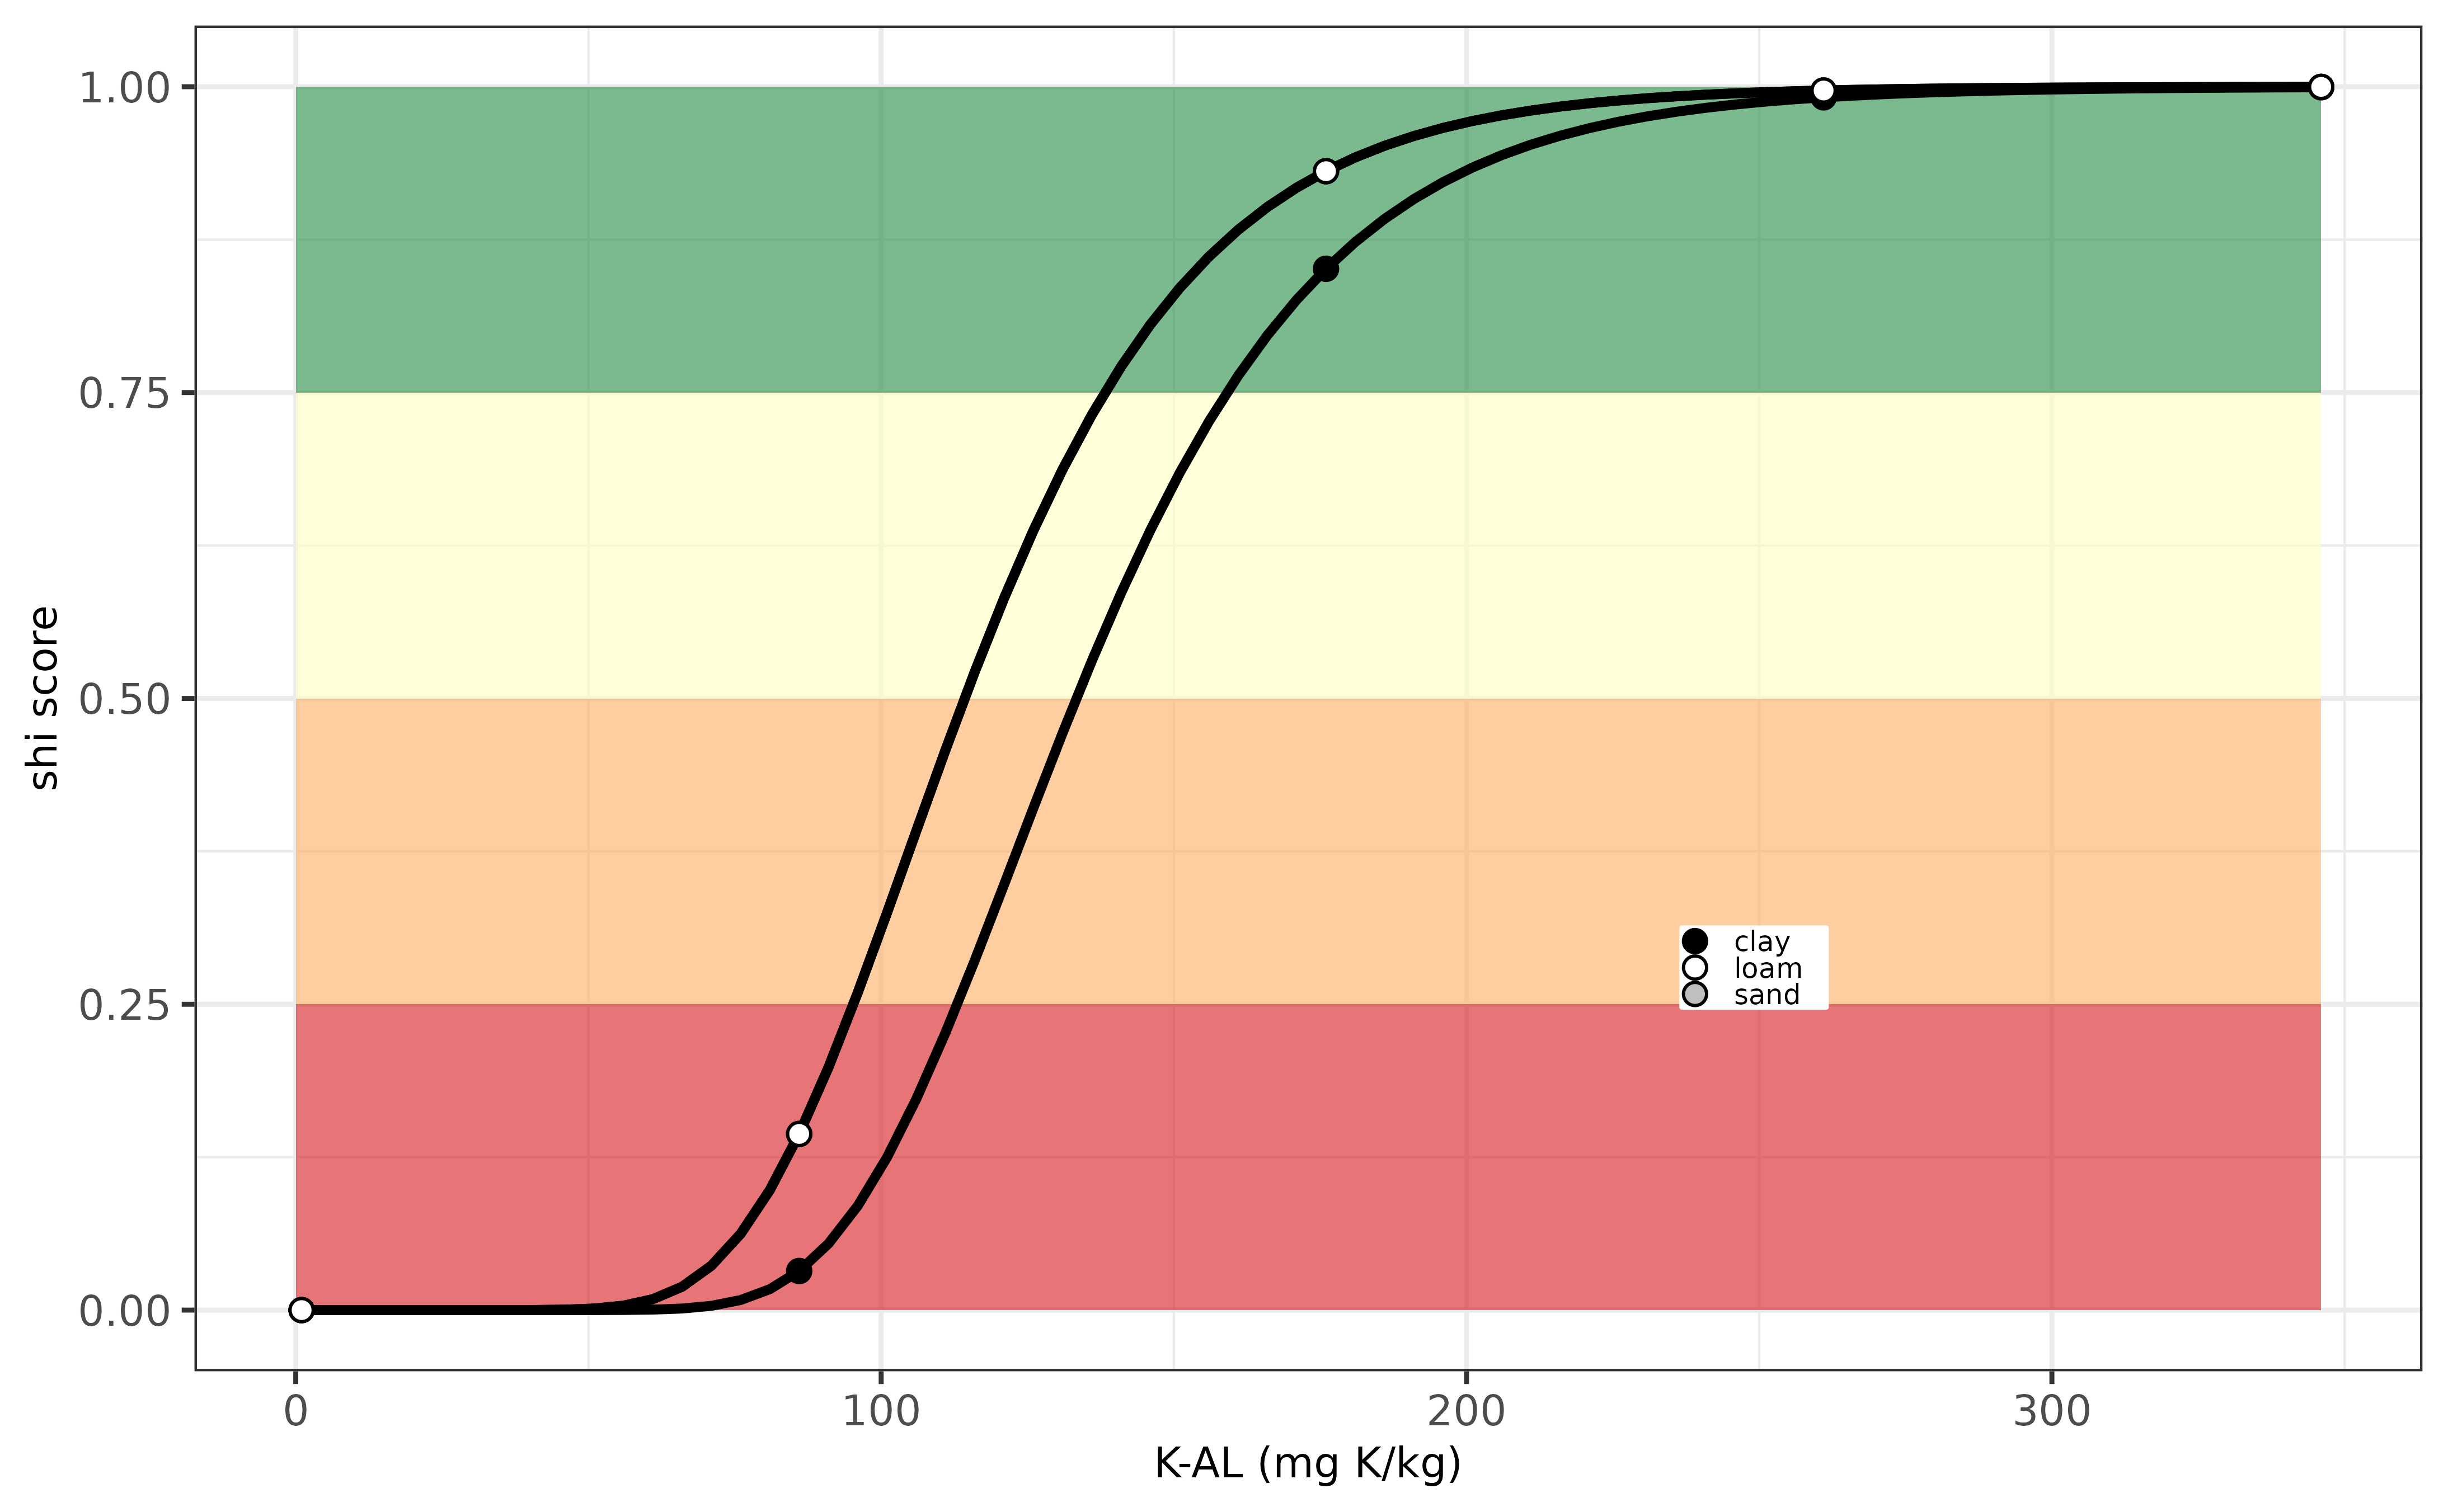
Below an example is visualized how the soil health index varies in relation to variation in K-CAL for a cropland soil. The optimum soil K threshold value for sustainable crop production is around 350 mg K/ kg for peat soils and around 200 mg K/kg for mineral soils. The soil index decreases when K-CAL values decreases down to 200 mg K/kg (peat soils) or 75-100 mg K/kg (mineral soils).
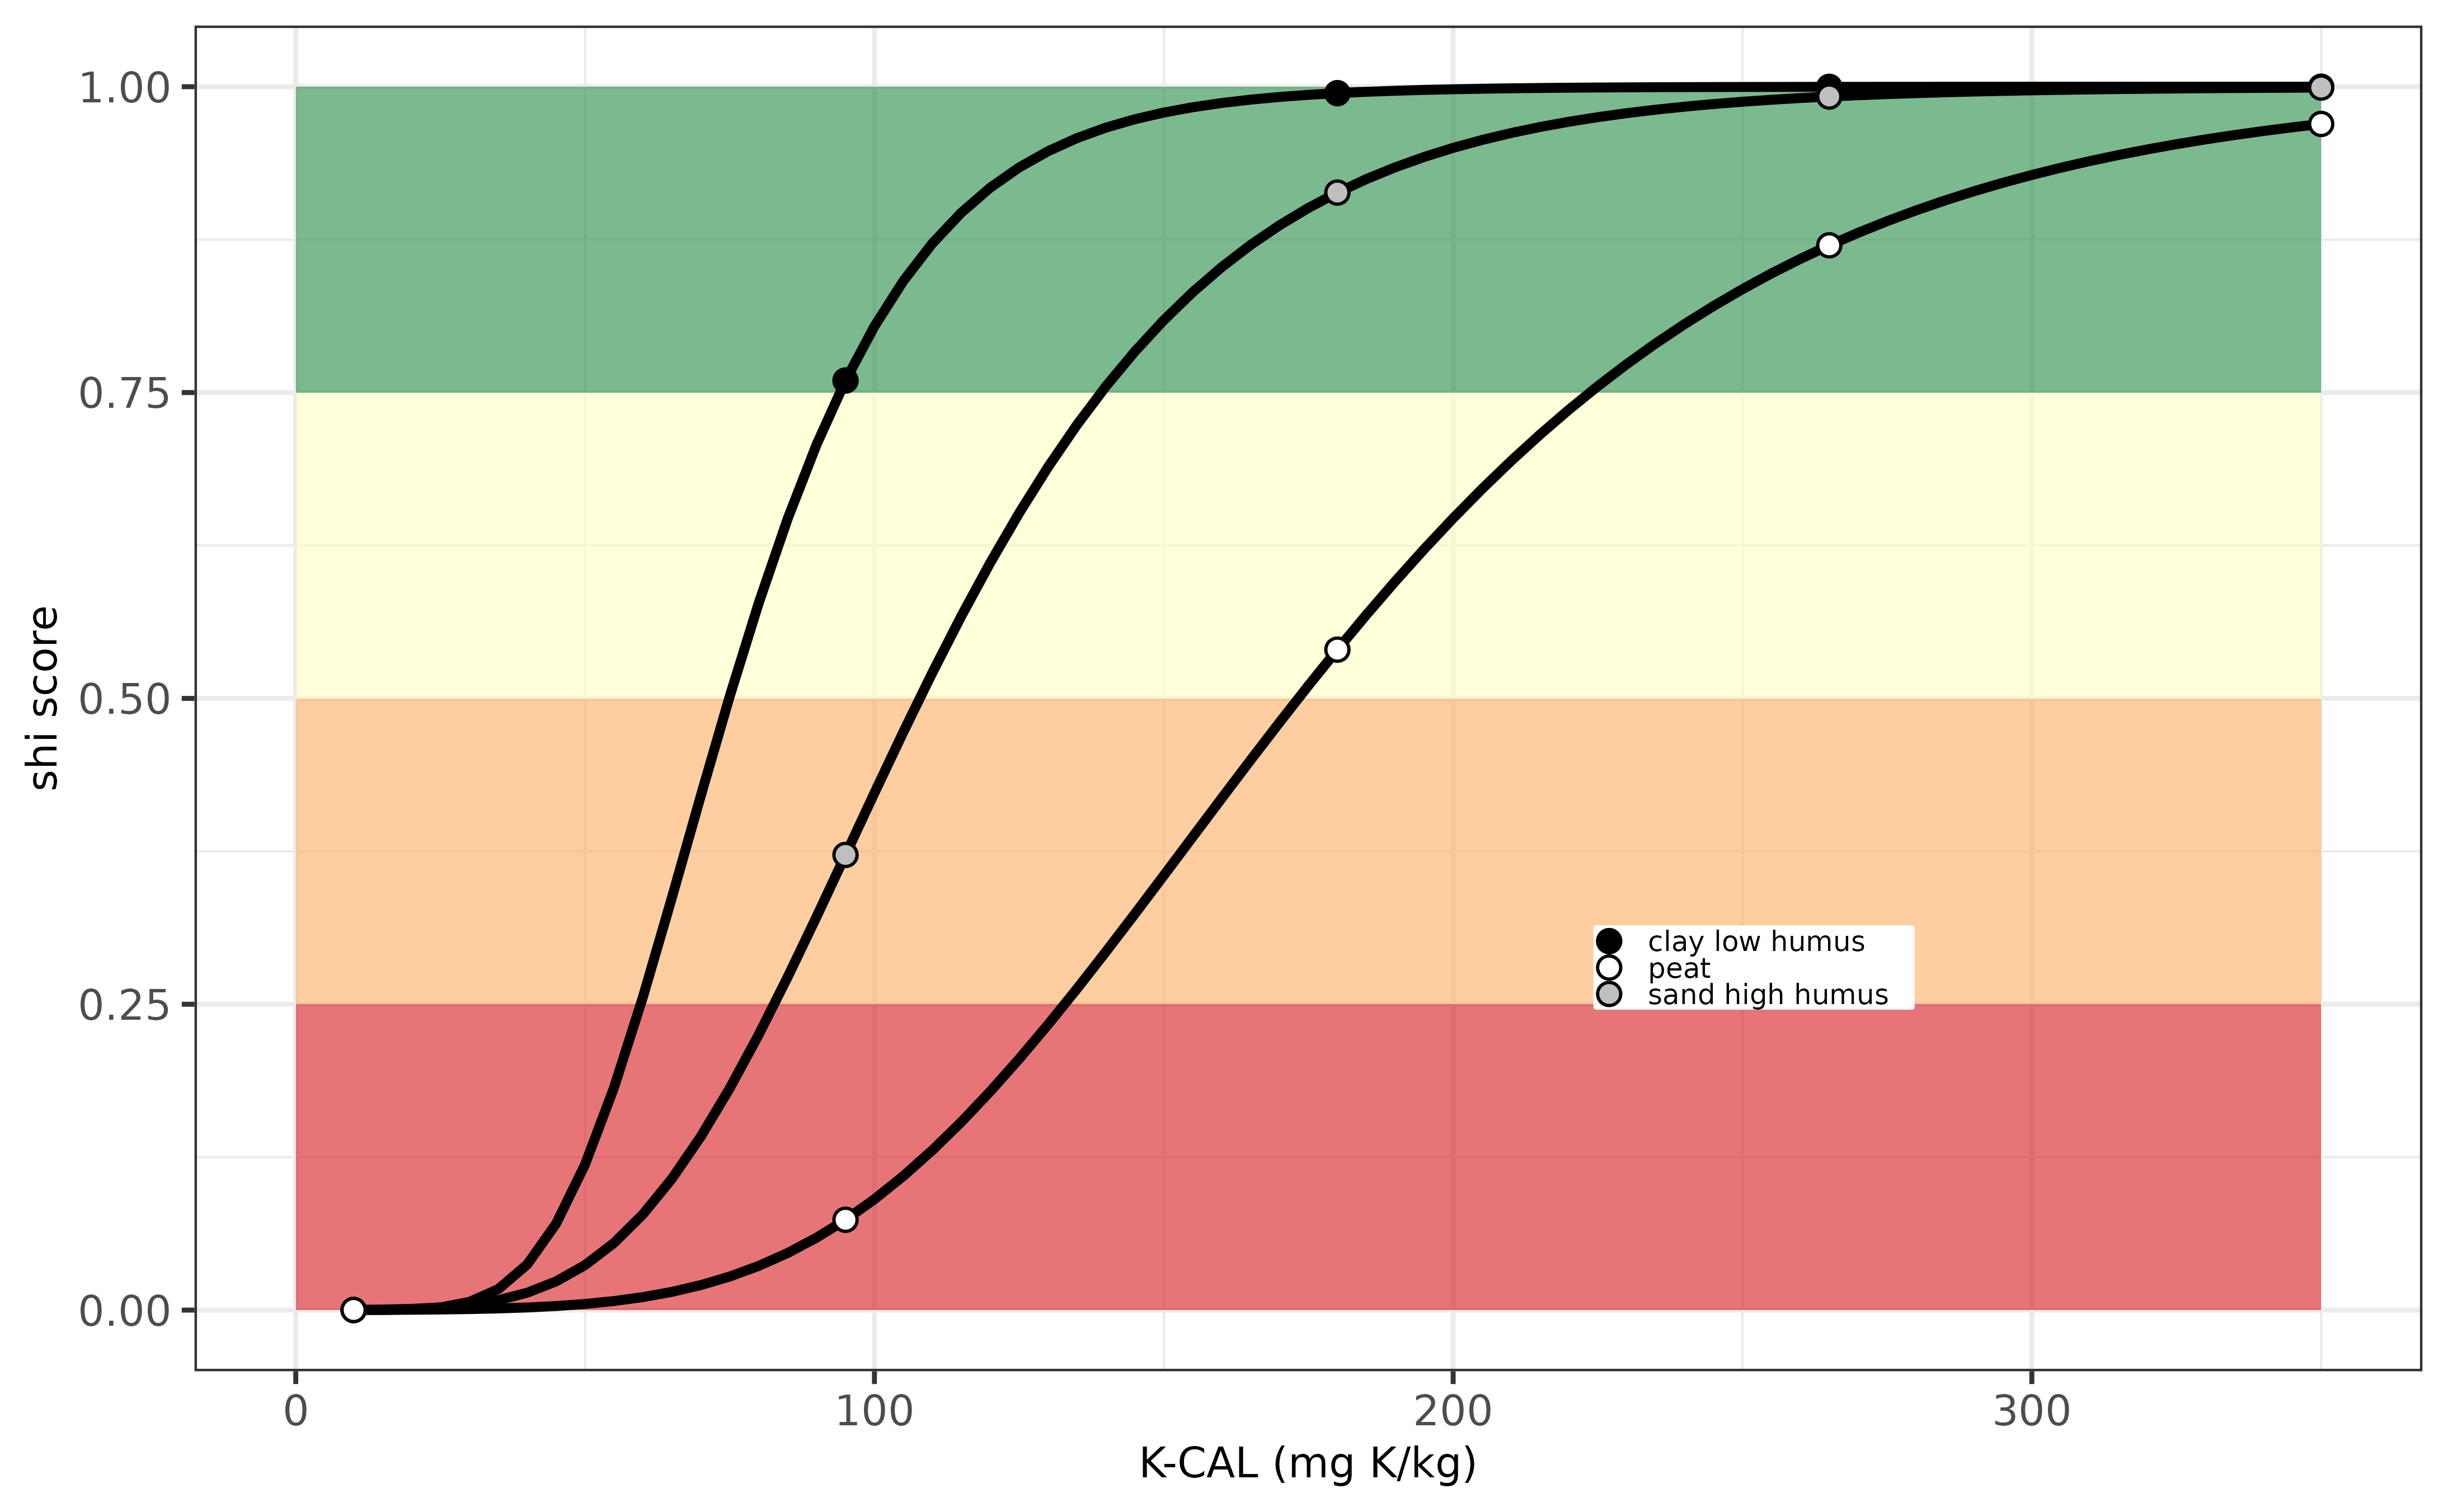
Evaluation K-indicator for Germany.
Denmark (DK)
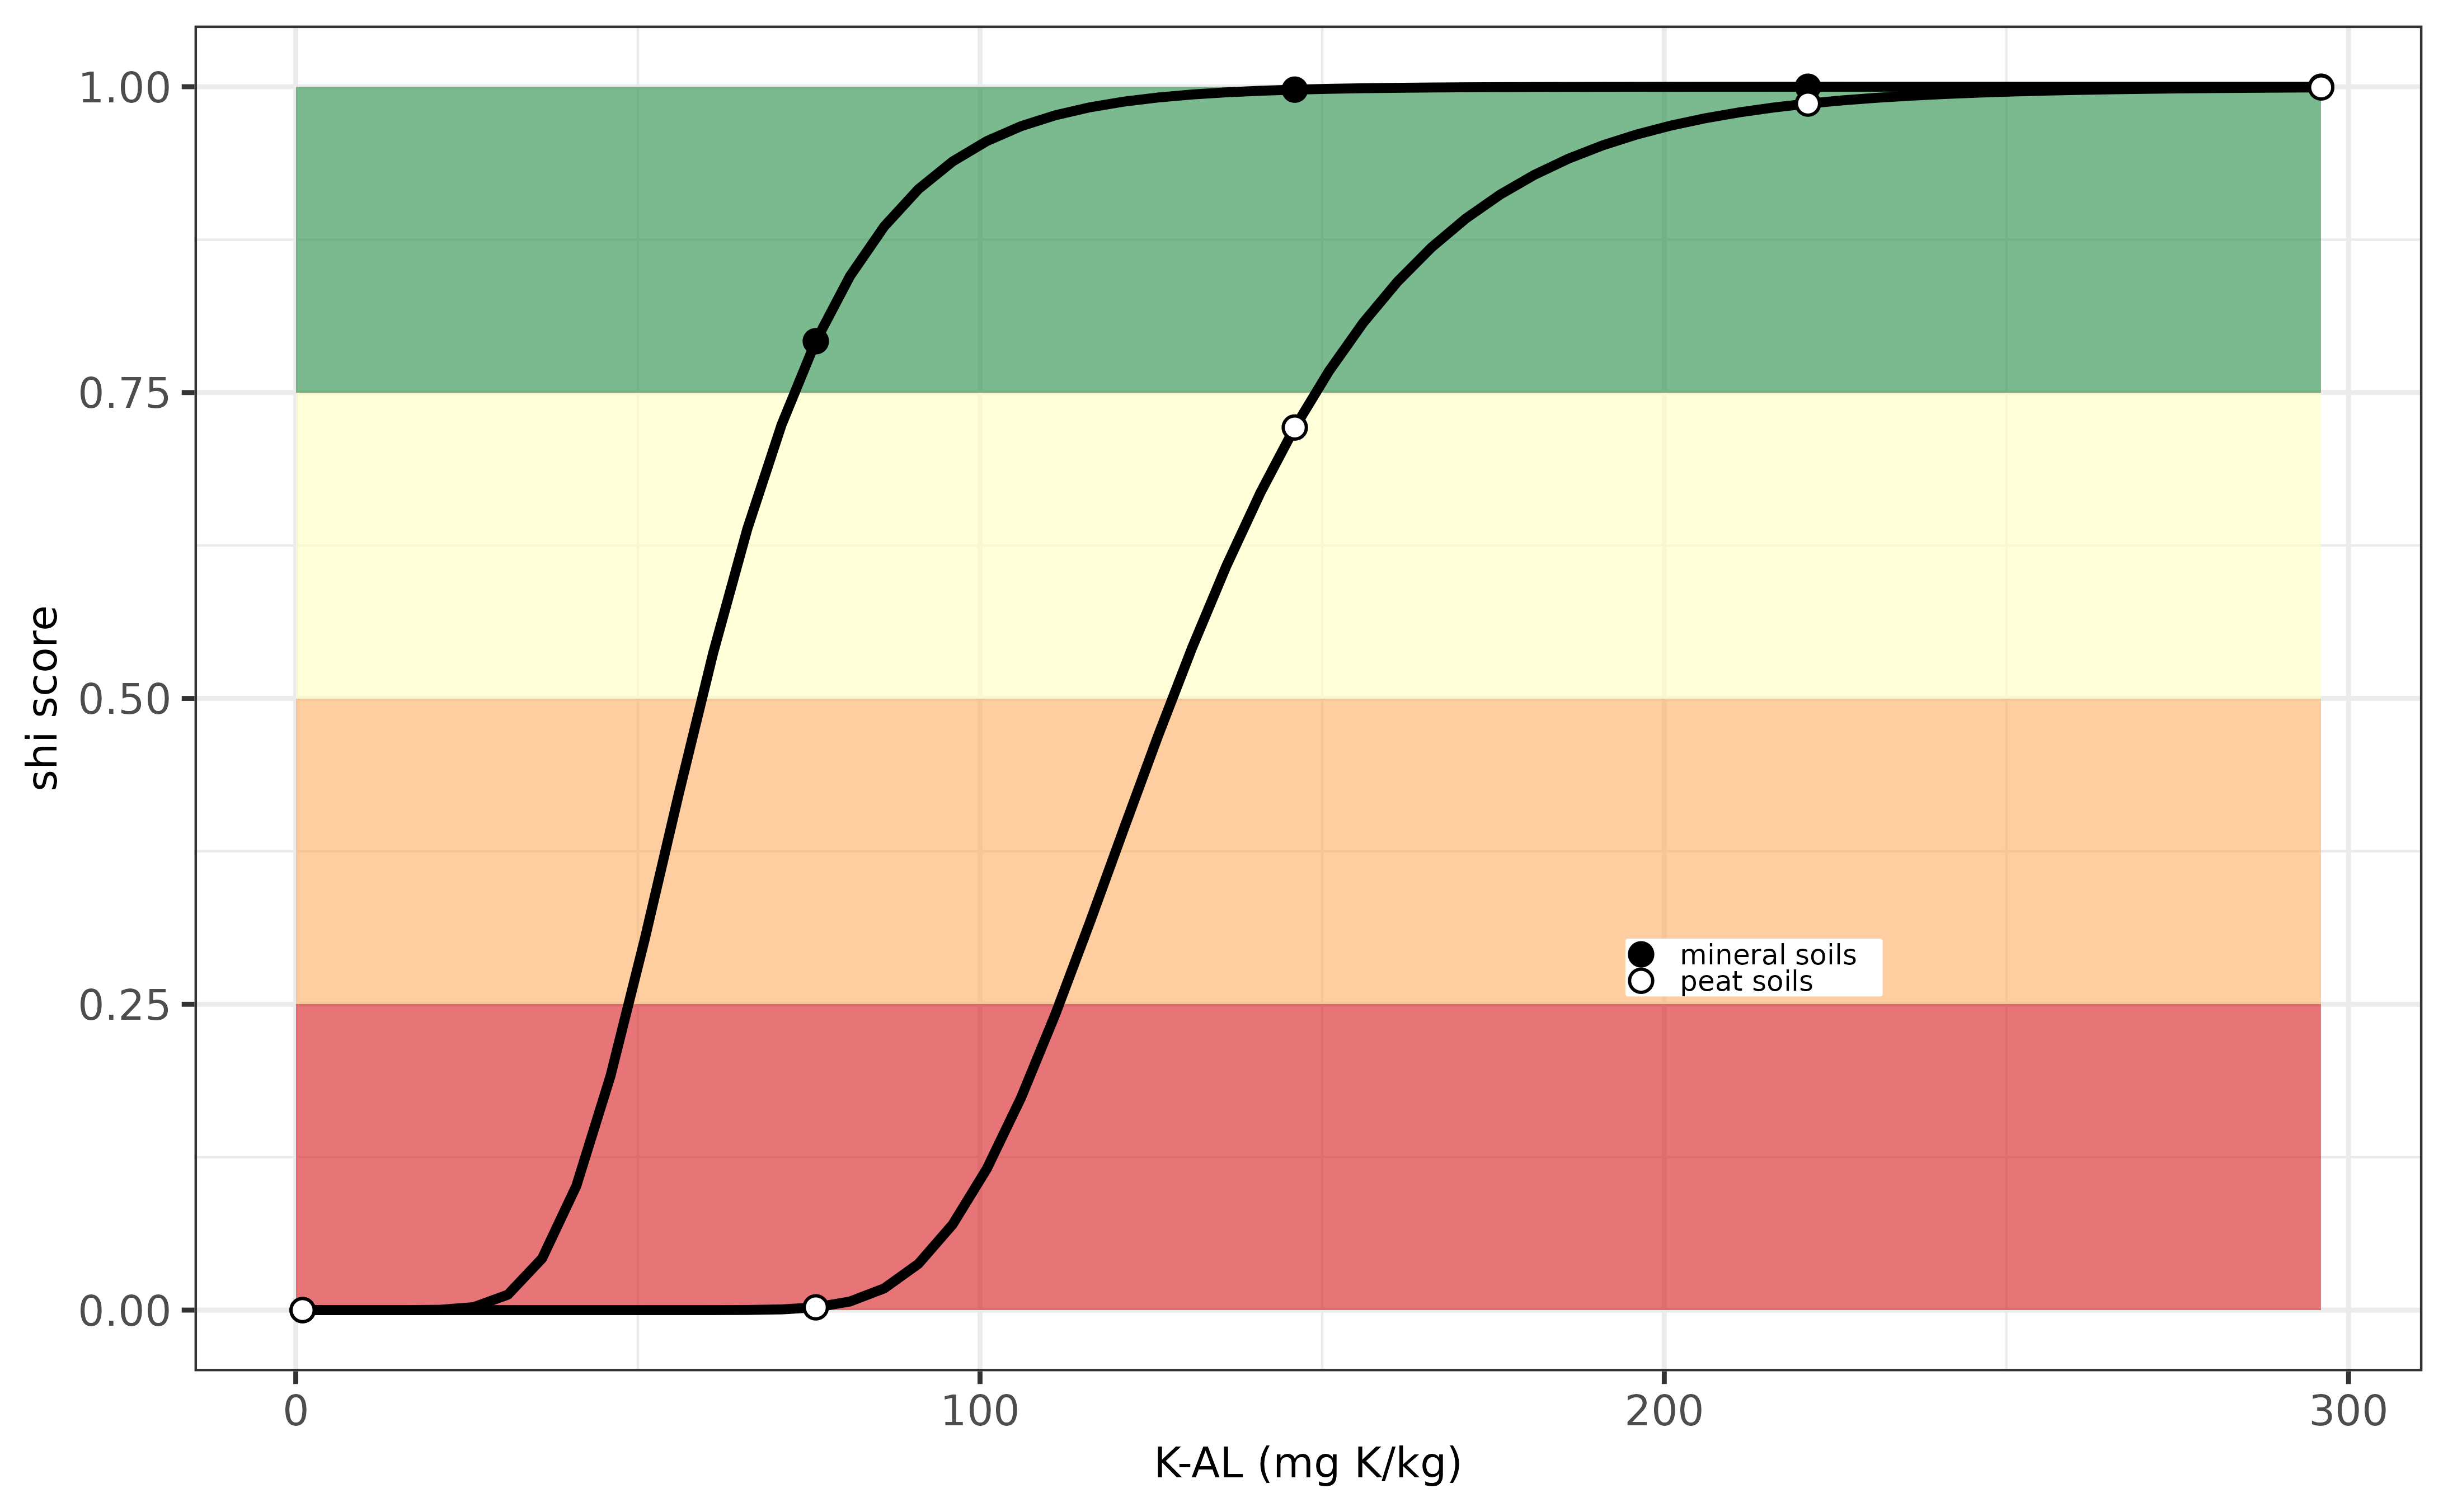
The potassium supply in Denmark is based on the K level in soil being
extracted with ammonium lactate. There is no distinction between
cropland or grassland or between soil types. More information of the
optimum threshold values and the soil K status evaluation can be found
in the IFA report entitled
POTASSIUM AND MAGNESIUM FERTILISER RECOMMENDATIONS IN SOME EUROPEAN COUNTRIES.
In the euosi package the soil health score for K supply can be
calculated with osi_c_potassium_dk, requiring the following
inputs:
- B_LU, being the crop code, an unique number for each crop
- A_K_AL, being the extracted K content with ammonium lactate, unit mg K /kg.
Note that the IACS crop codes for Denmark are available in
osi_crops package table.
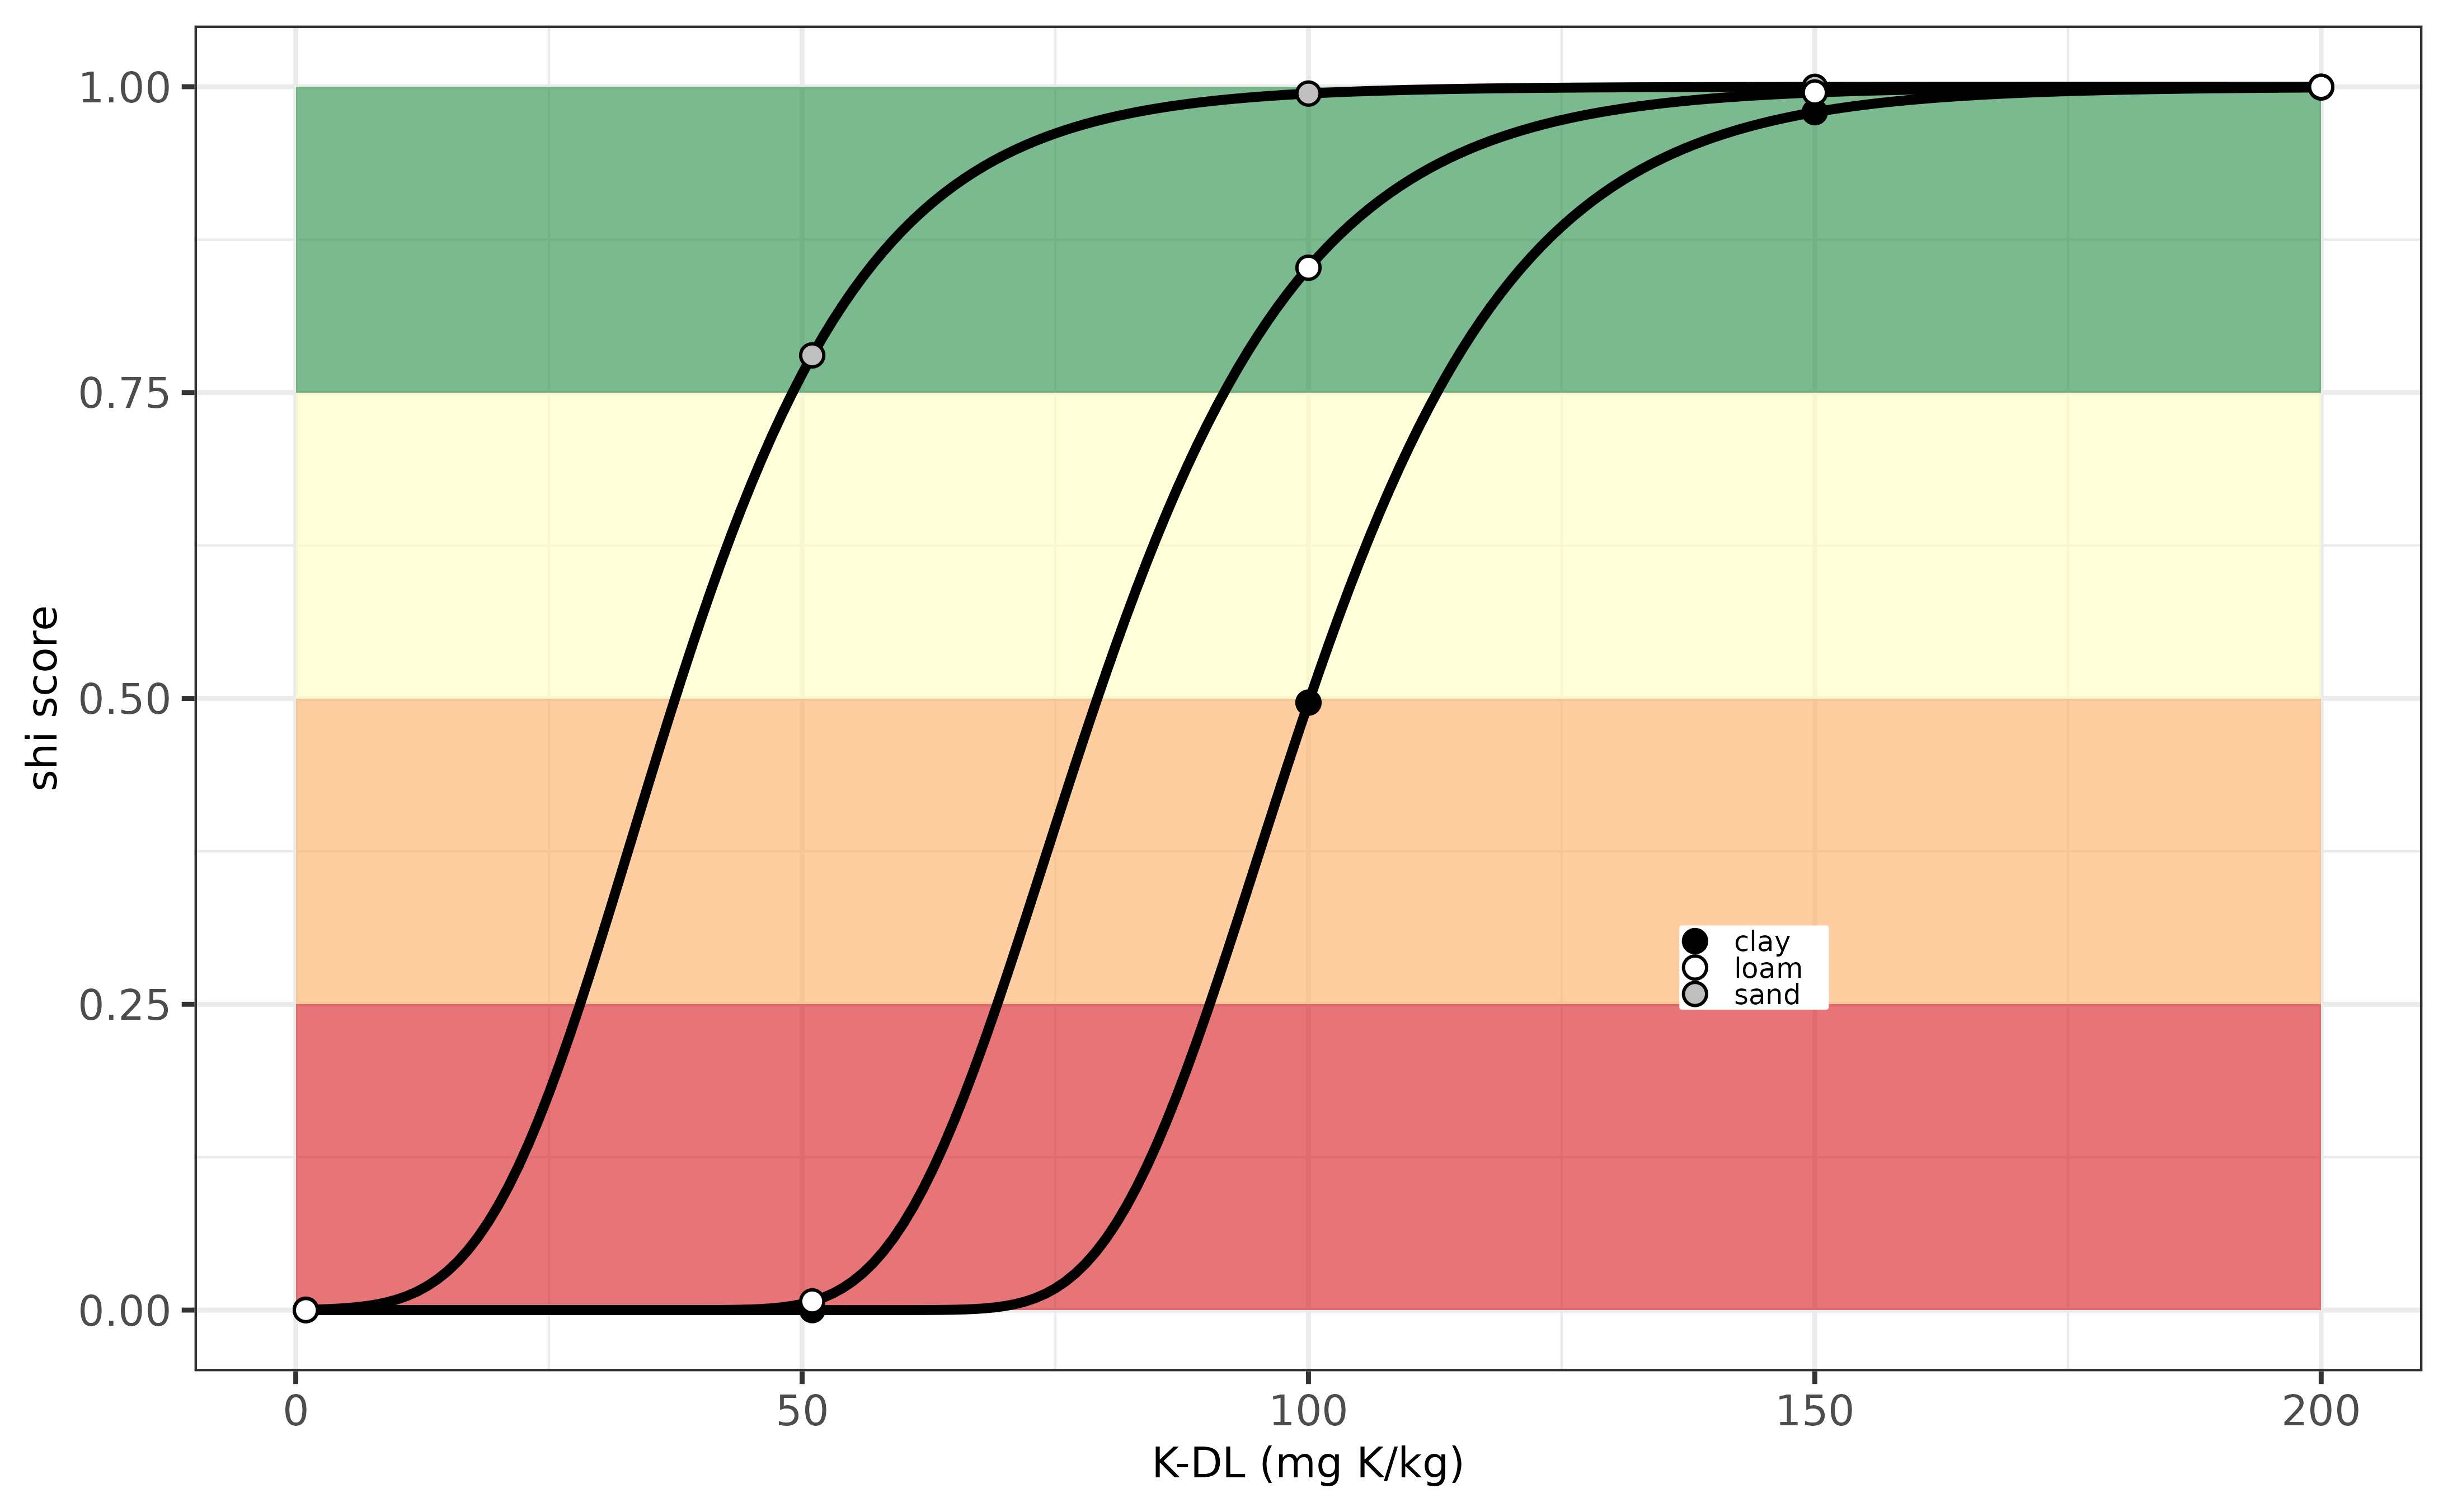
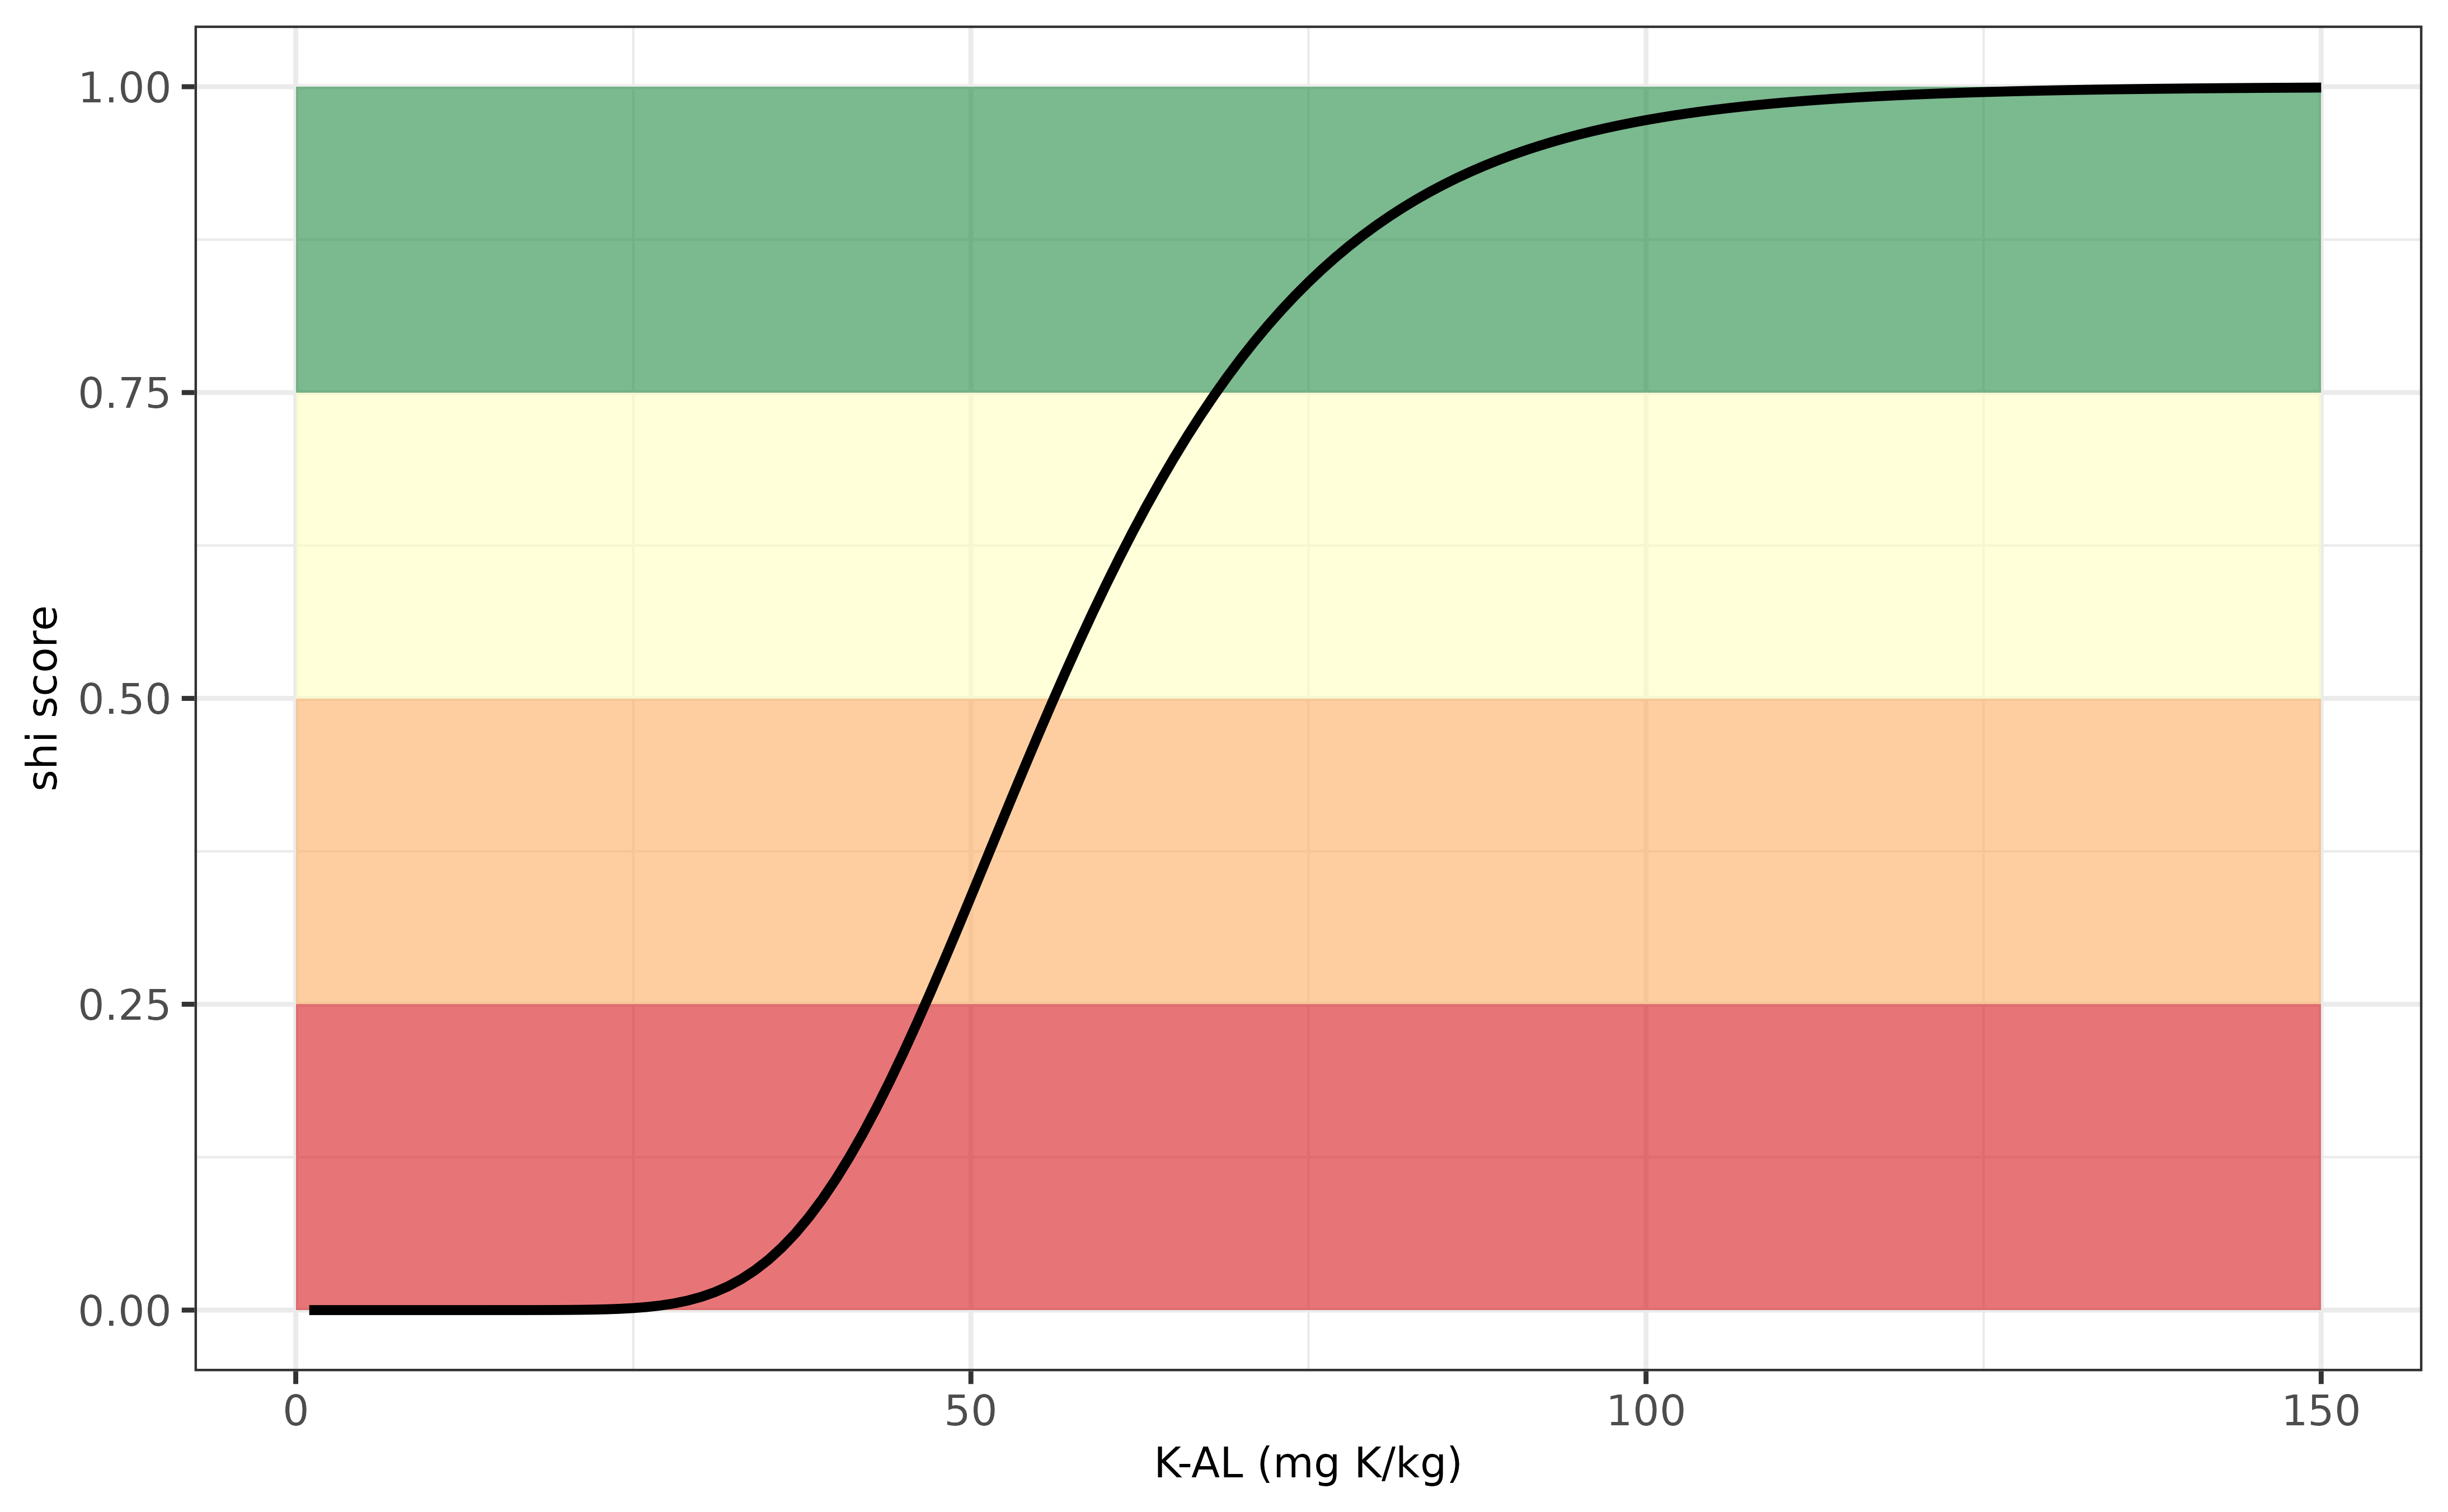
Below the same example but then visualised for a series of soils with a K-AL value ranging from 0 to 250 mg K per kg. The optimum soil K threshold value for sustainable crop production is around 150 mg K/ kg for all soils. The soil index decreases when K-AL,in particular below a K content of 75 mg K/kg.
Evaluation K-indicator for the Denmark.
Estonia (EE)
The potassium supply in view of soil health for agricultural soils in
Estonia can be calculated using osi_c_potassium_ee using
the following inputs:
- B_LU, being the crop code, an unique number for each crop
- A_K_M3, being the extracted K content with Mehlich-III, unit mg K /kg.
- B_TEXTURE_USDA, being the soil texture class according to USDA classification system
The K supplying capacity differs in soils with varying textures.
Based on the soil mineralogy (clay, sand and silt content) one can
easily classify the USDA texture class using
osi_get_TEXTURE_USDA. Information on the threshold values
for P-Mehlich in view of sustainable crop production has been derived
from Fotyma et al. (2008) who wrote a comprehensive overview of soil
testing methods in Eastern Europe entitled “Soil testing methods and
fertilizer recommendations in Central–Eastern European countries”.
Note that the IACS crop codes for Estonia are not yet available in
osi_crops package table.
Below an example is visualized how the soil health index varies in relation to variation in K Mehlich-III. The optimum soil K threshold value for sustainable crop production is around 75 mg K/ kg for sand, around 175 mg K /kg for loam and around 225 mg K /kg for clay soils. Similarly, K deficiencies might occur when K-M3 declines to 150 mg K/ kg for clay soils down to 50 mg K/kg for sandy soils.
Evaluation K-indicator for Estonia.
Greece (EL)
The potassium supply in view of soil health for agricultural soils in
Greece can be calculated using osi_c_potassium_el using the
following inputs:
- B_LU, being the crop code, an unique number for each crop
- A_K_AAA, being the extracted K content with acid ammonium acetate, unit mg K /kg
The evaluation of the K supply is similar for all soil types and land uses. Fertilizer manuals have not been found yet, but asking ChatGPT hinted to a study of Bilias doing K tests with Cate-Nelson method to derive optimum. Teaching/extension practice (lab manual used in Greek soil labs): sufficiency threshold often cited around 250–300 mg/kg exchangeable K. No working reference was provided.
Note that crop codes for Greece are not yet available in
osi_crops package table.
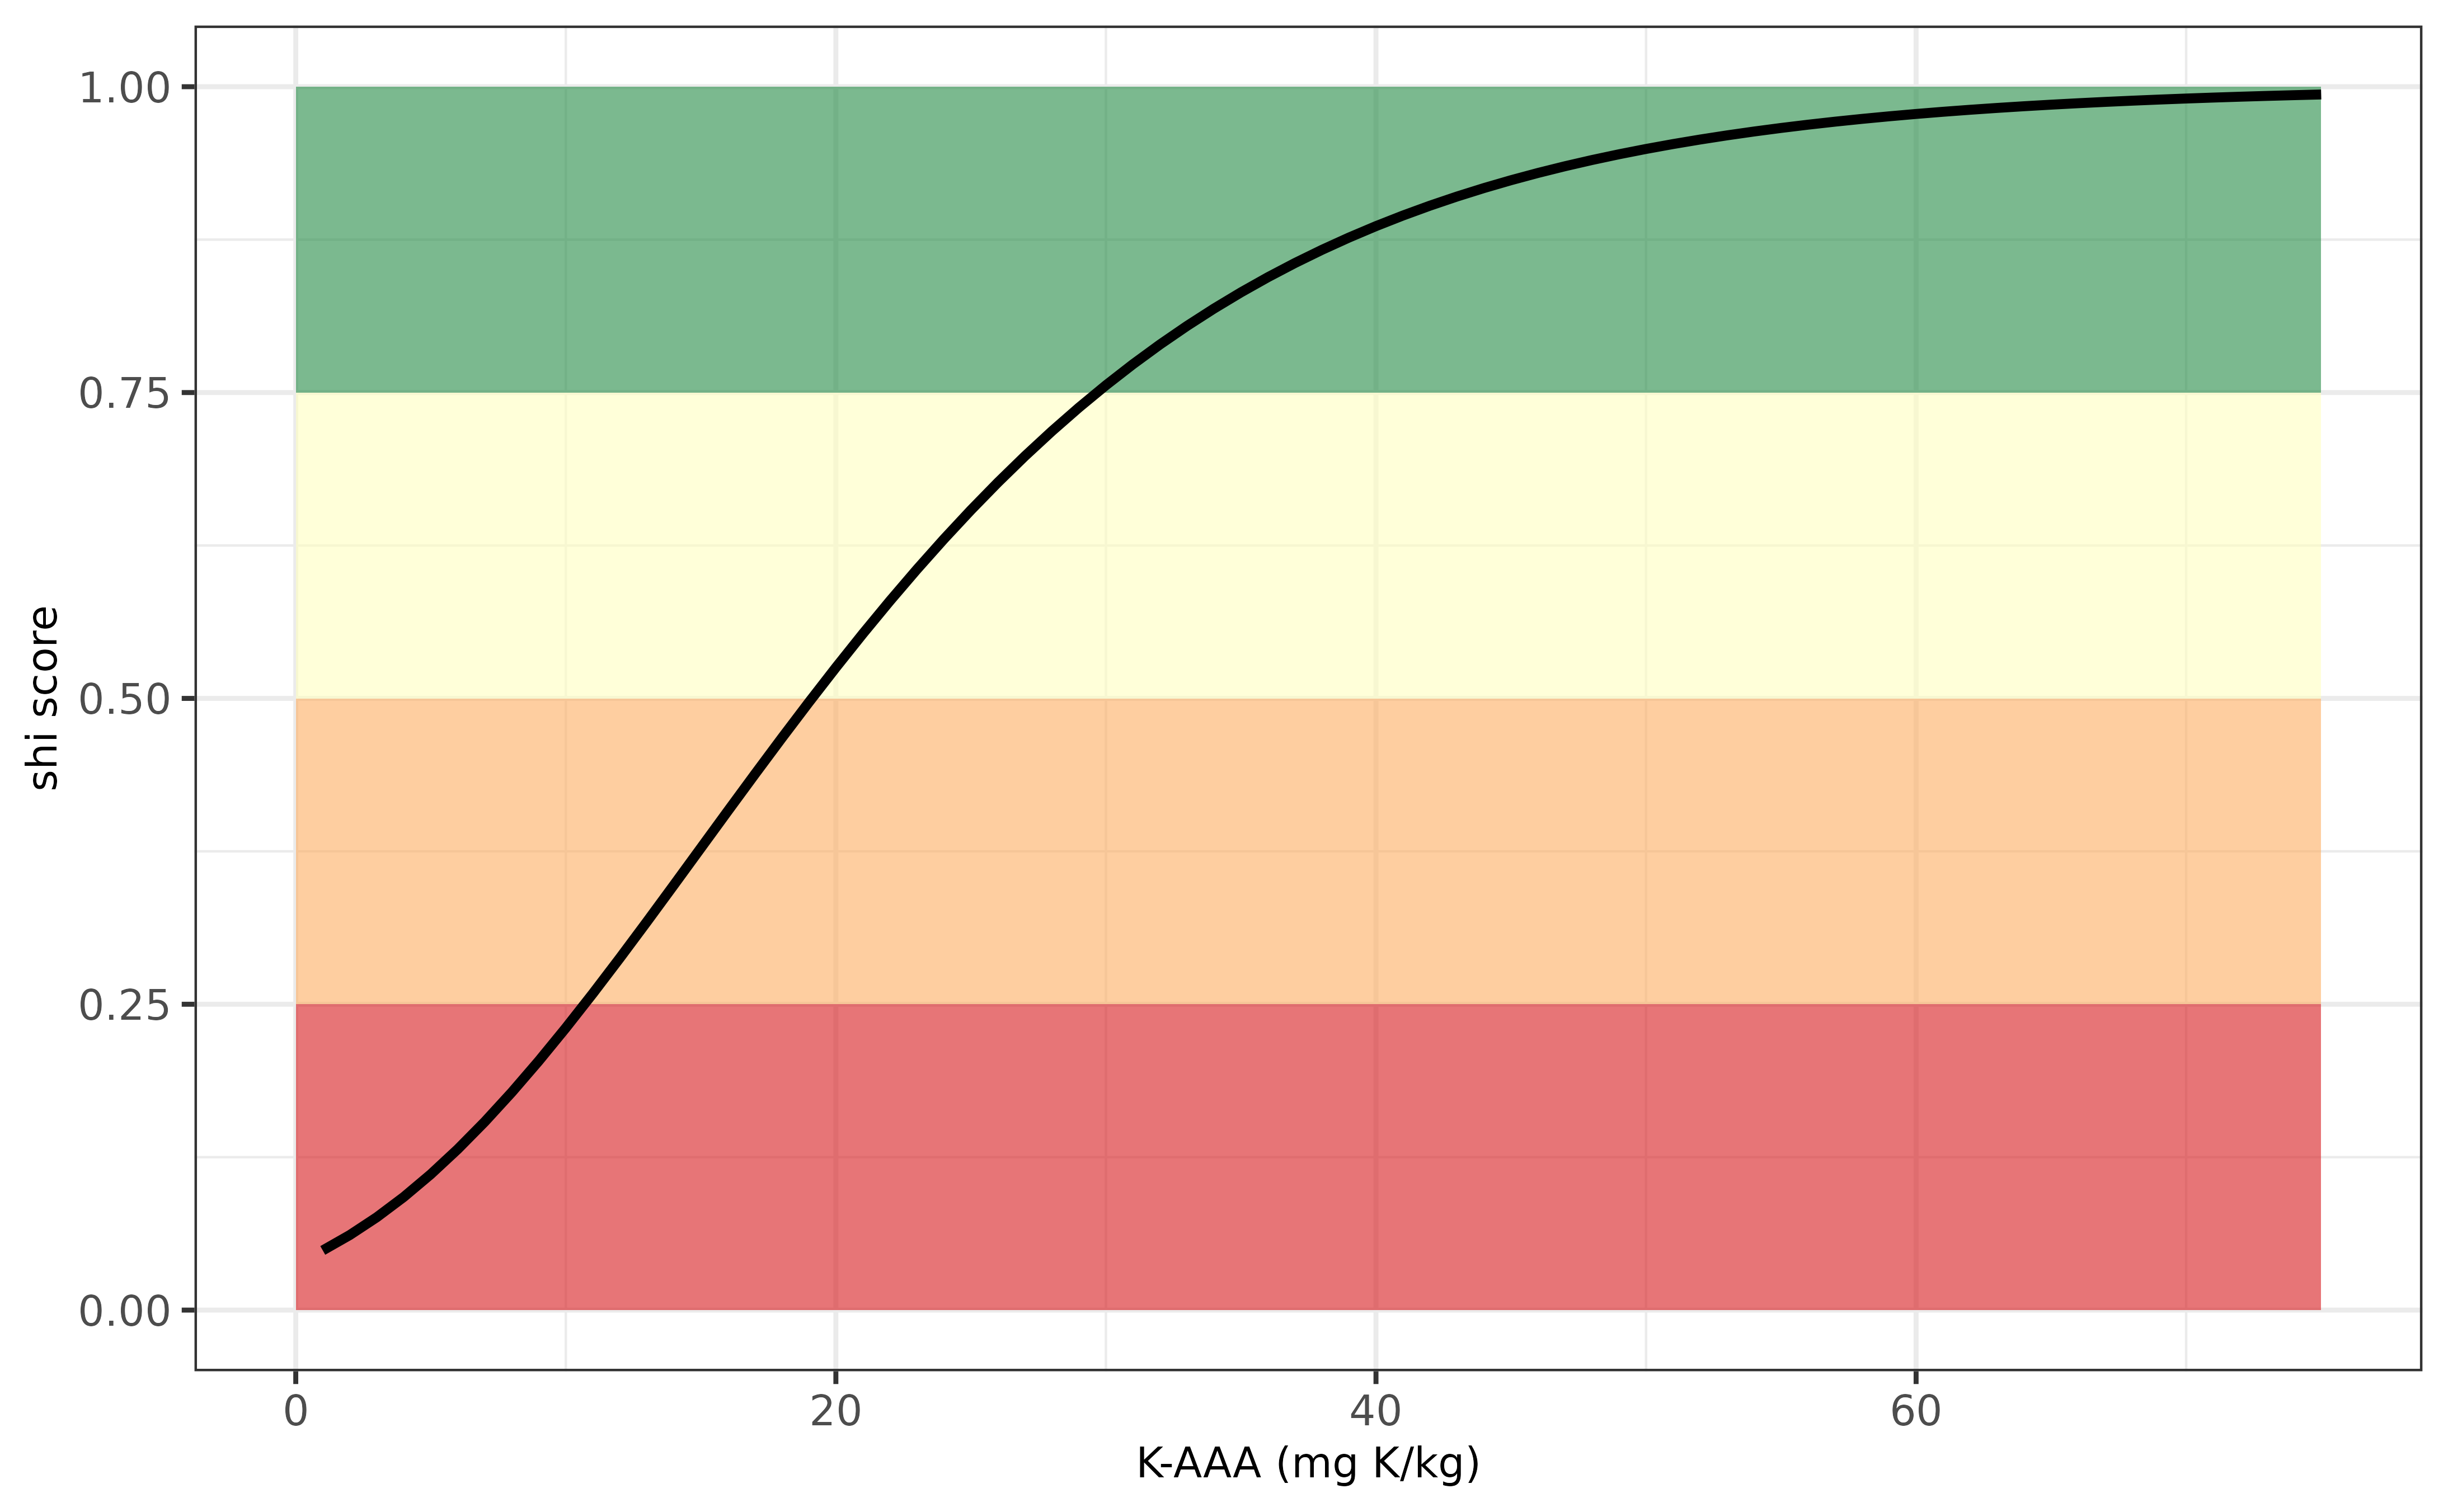
Below an example is visualized how the soil health index varies in relation to variation in K-AAA. The optimum soil K threshold value for sustainable crop production is around 275 mg K/ kg, and the soil index decreases when K_AAA values decreases down to 30 mg K/kg. There is no differntiation among soil types of land uses.
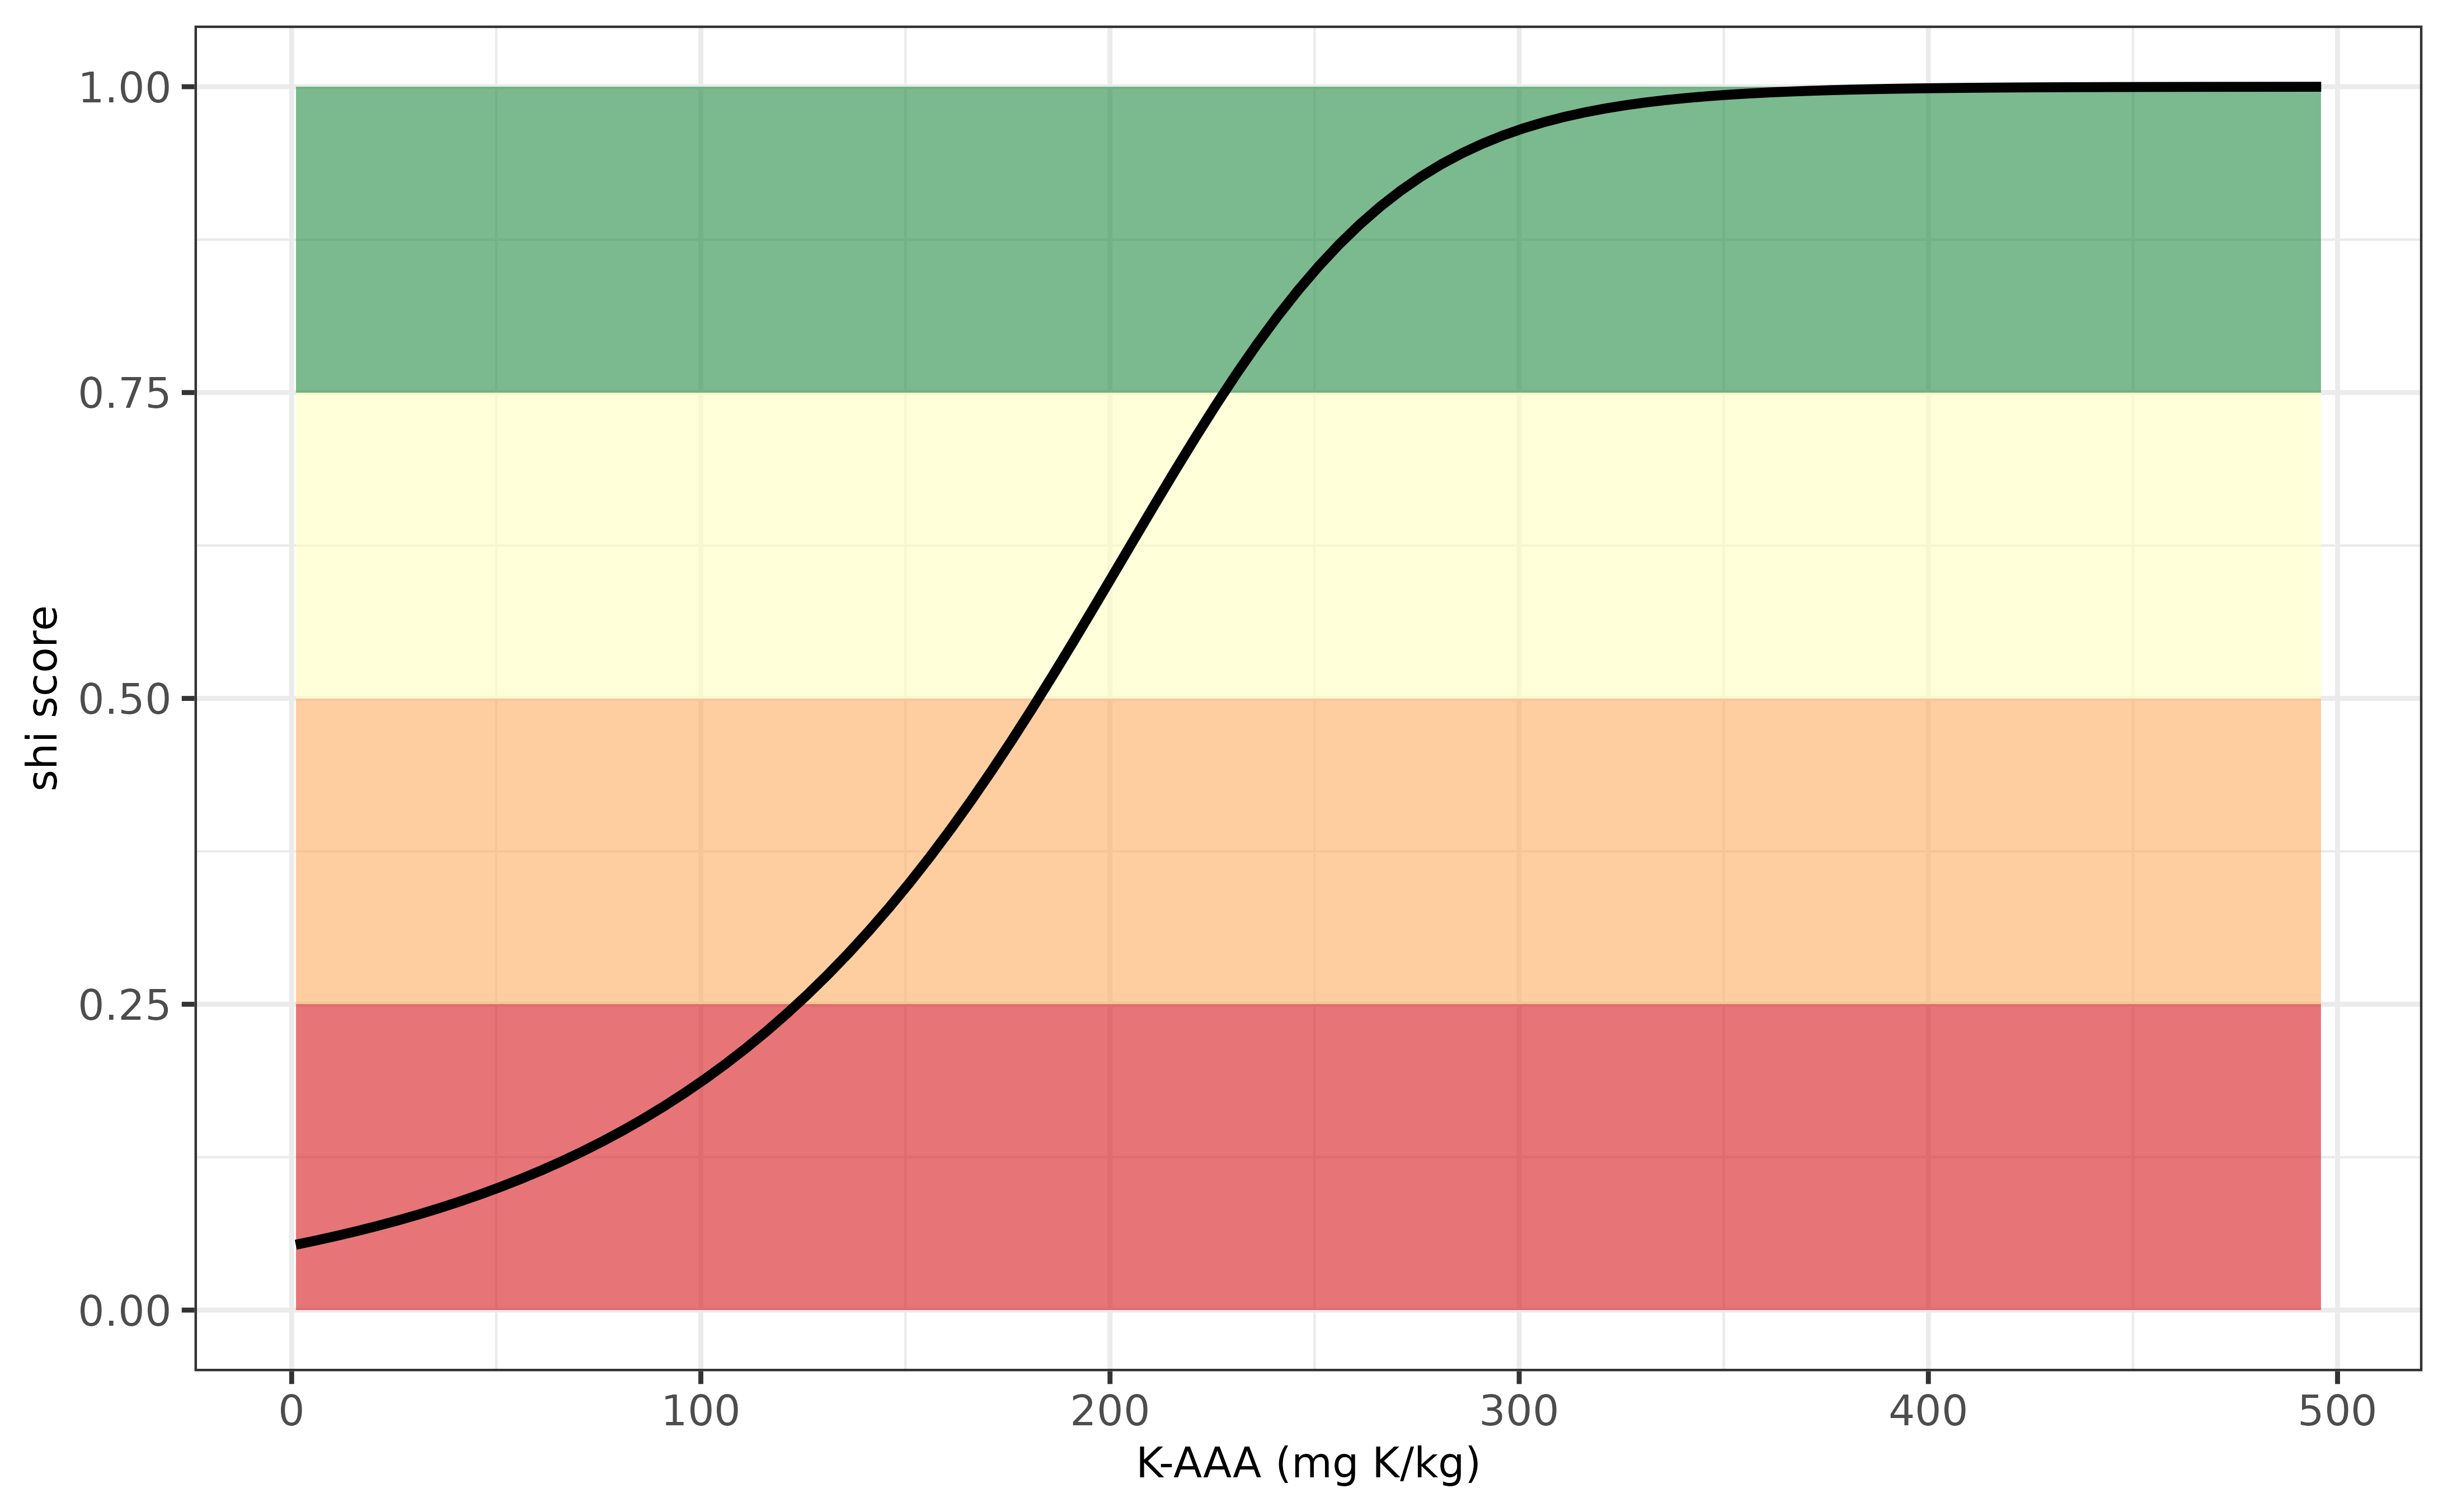
Evaluation K-indicator for Greece.
Spain (ES)
The potassium supply in view of soil health for agricultural soils in
Spain can be calculated using osi_c_potassium_es using the
following inputs:
- B_LU, being the crop code, an unique number for each crop
- B_TEXTURE_HYPRES, being the soil texture class according to HYPRES classification system
- A_K_AAA, being the extracted K content with acid ammonium acetate, unit mg K /kg
The K supplying capacity differ for soils varying in clay content, and the soil health assessment differs with the texture class, distinghuising sandy (Arenoso), loamy (Franco) and clayey (Arcilloso) soils. Information on the threshold values for K-AAA in view of sustainable crop production has been derived by the fertilizer guidelines handbook entitled “PRÁCTICA DE LA FERTILIZACIÓN RACIONAL DE LOS CULTIVOS EN ESPAÑA”. This book is online available here.
Note that IACS crop codes for Spain are available in
osi_crops package table.
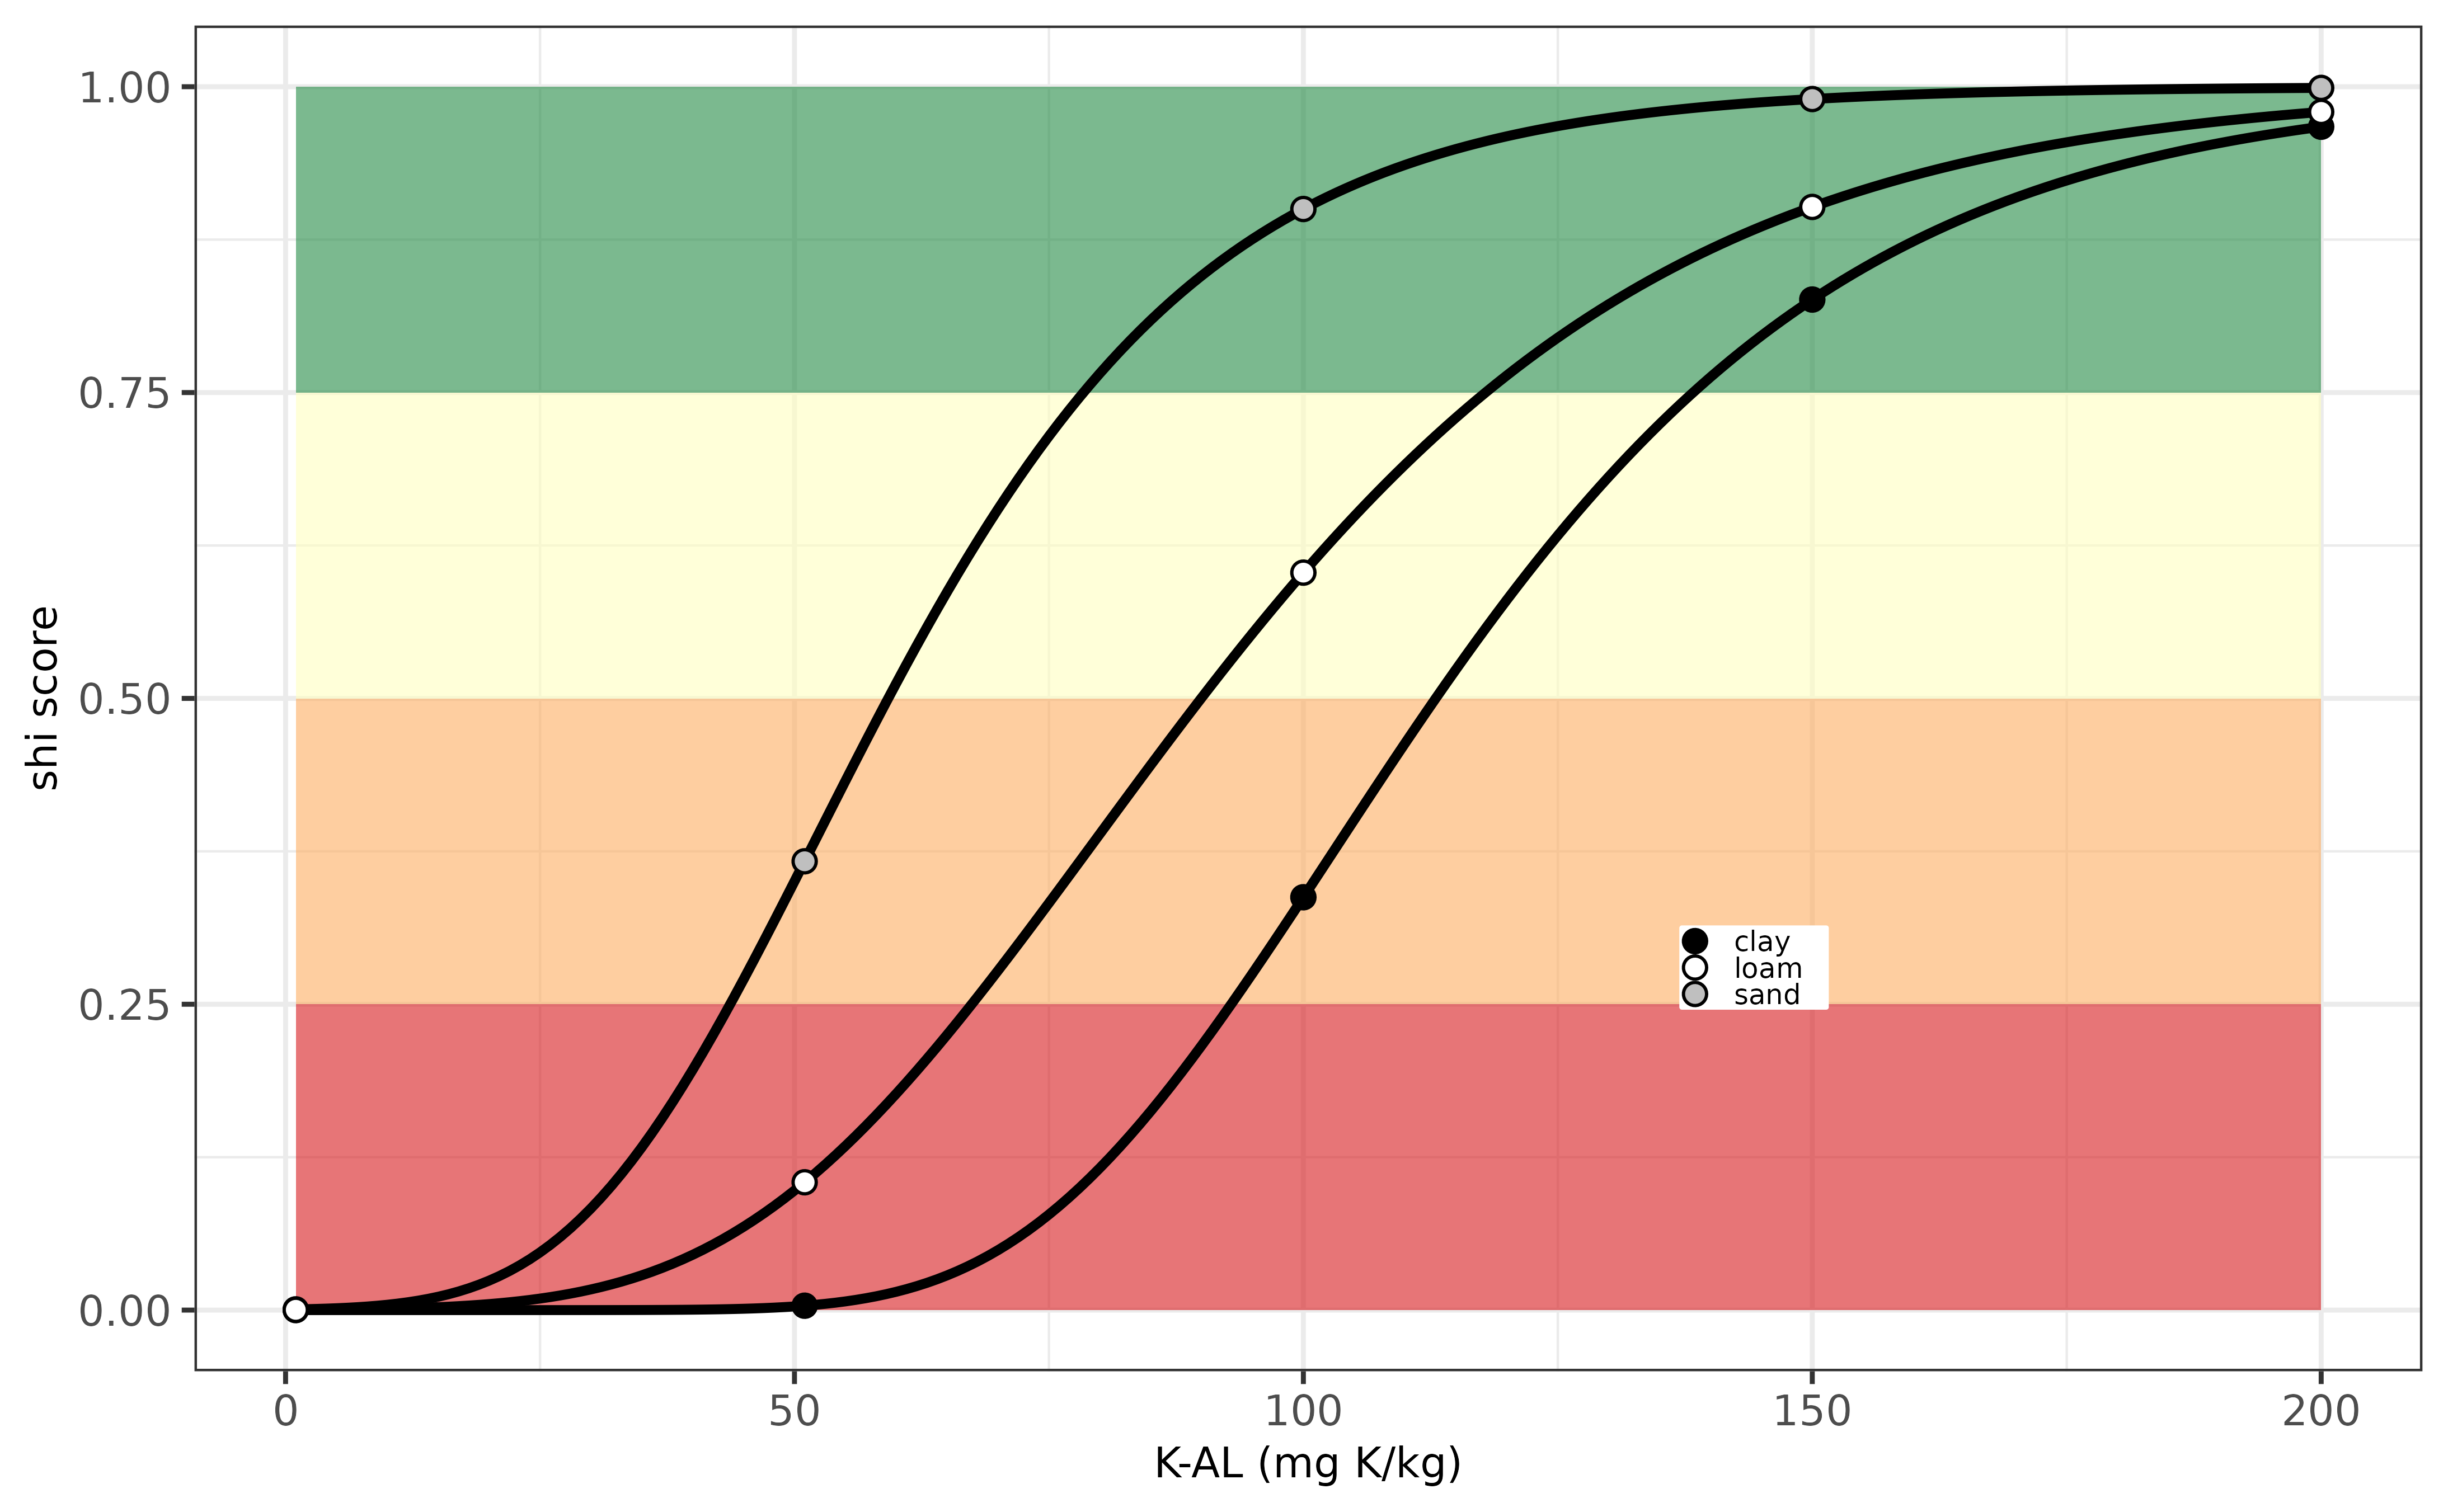
Below an example is visualized how the soil health index varies in relation to variation in K-AAA. The optimum soil K threshold value for sustainable crop production is around 300 mg K/ kg for the three soil types. The soil index decreases more stronger on the clay soils, in particular when K-AAA values drop down to 140 mg K/kg. For the sand soil the K availability remains quite high down to 75 mg K/kg.
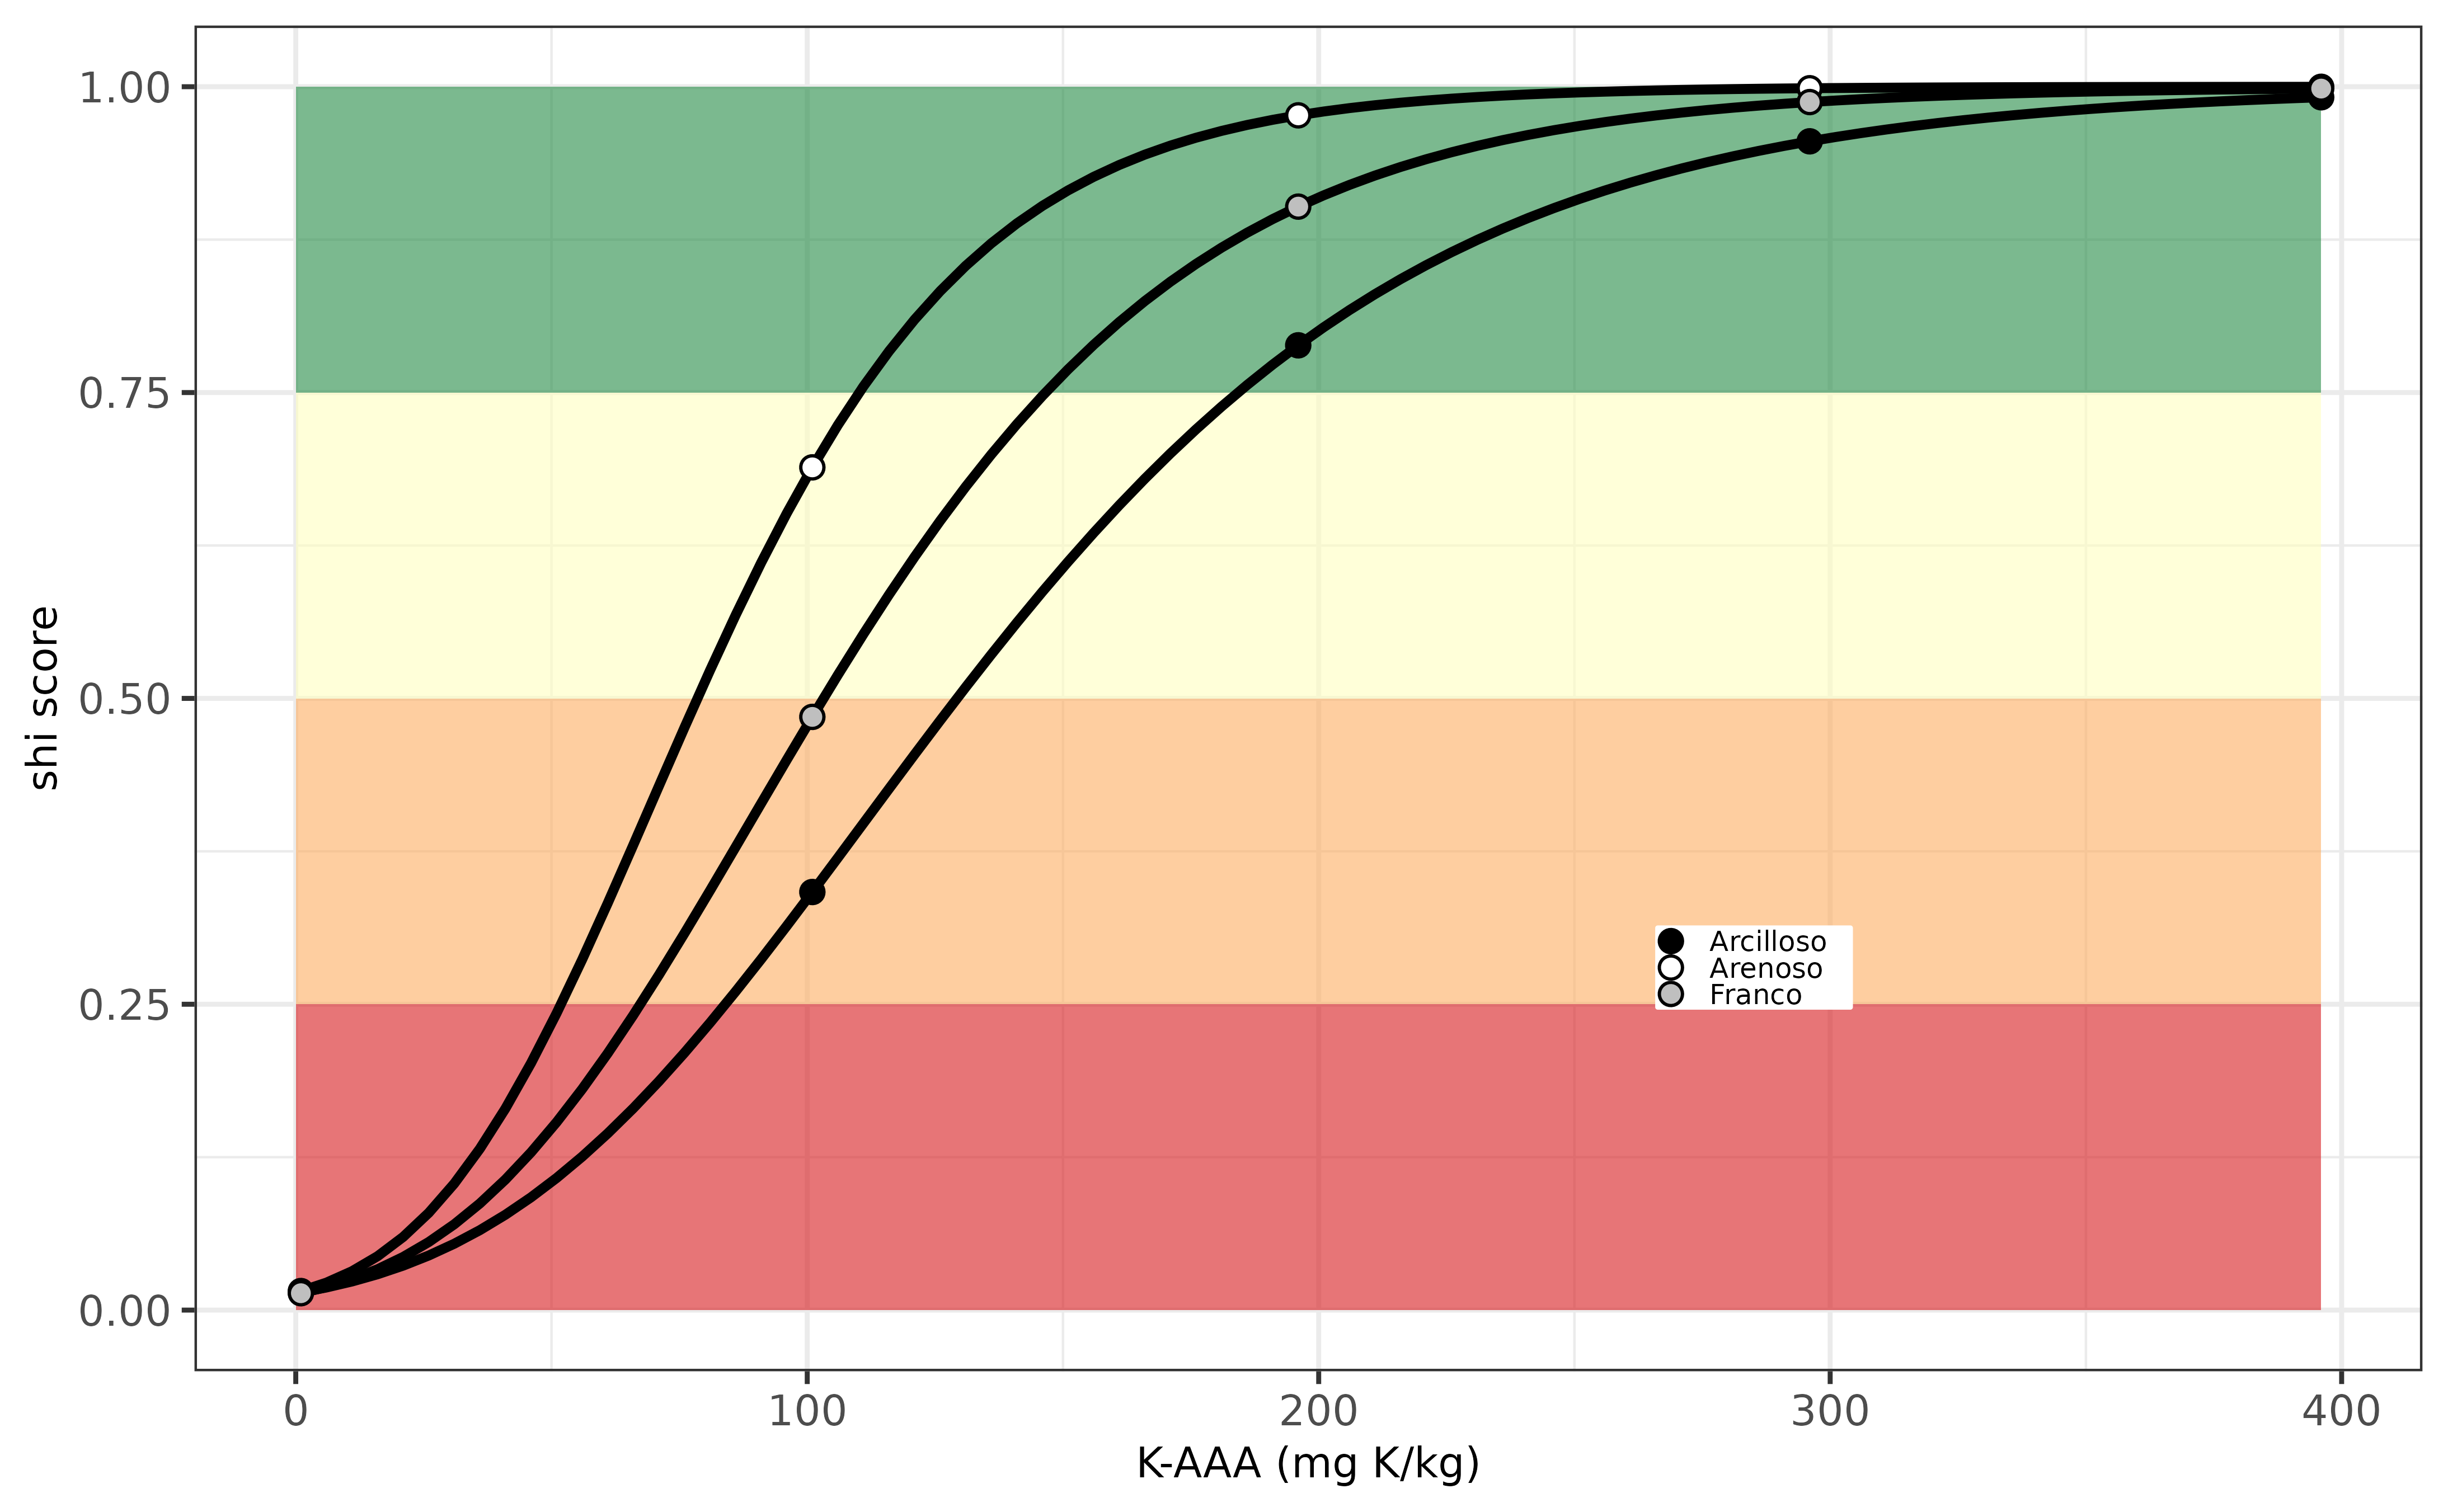
Evaluation K-indicator for Spain.
Finland (FI)
The potassium supply in view of soil health for agricultural soils in
Finland can be calculated using osi_c_potassium_fi using
the following inputs:
- B_LU, being the crop code, an unique number for each crop
- B_TEXTURE_USDA, being the soil texture class according to USDA classification system
- A_K_AAA, being the extracted K content with ammonium acetate extraction, unit mg K /kg.
- A_C_OF, being the organic carbon content of the soil, in unit g C/kg, to distinghuish between mineral and peat soils.
The K supplying capacity differs in soils with varying textures.
Based on the soil mineralogy (clay, sand and silt content) one can
easily classify the USDA texture class using
osi_get_TEXTURE_USDA.
Note that the crop codes for Finland are available in
osi_crops package table.
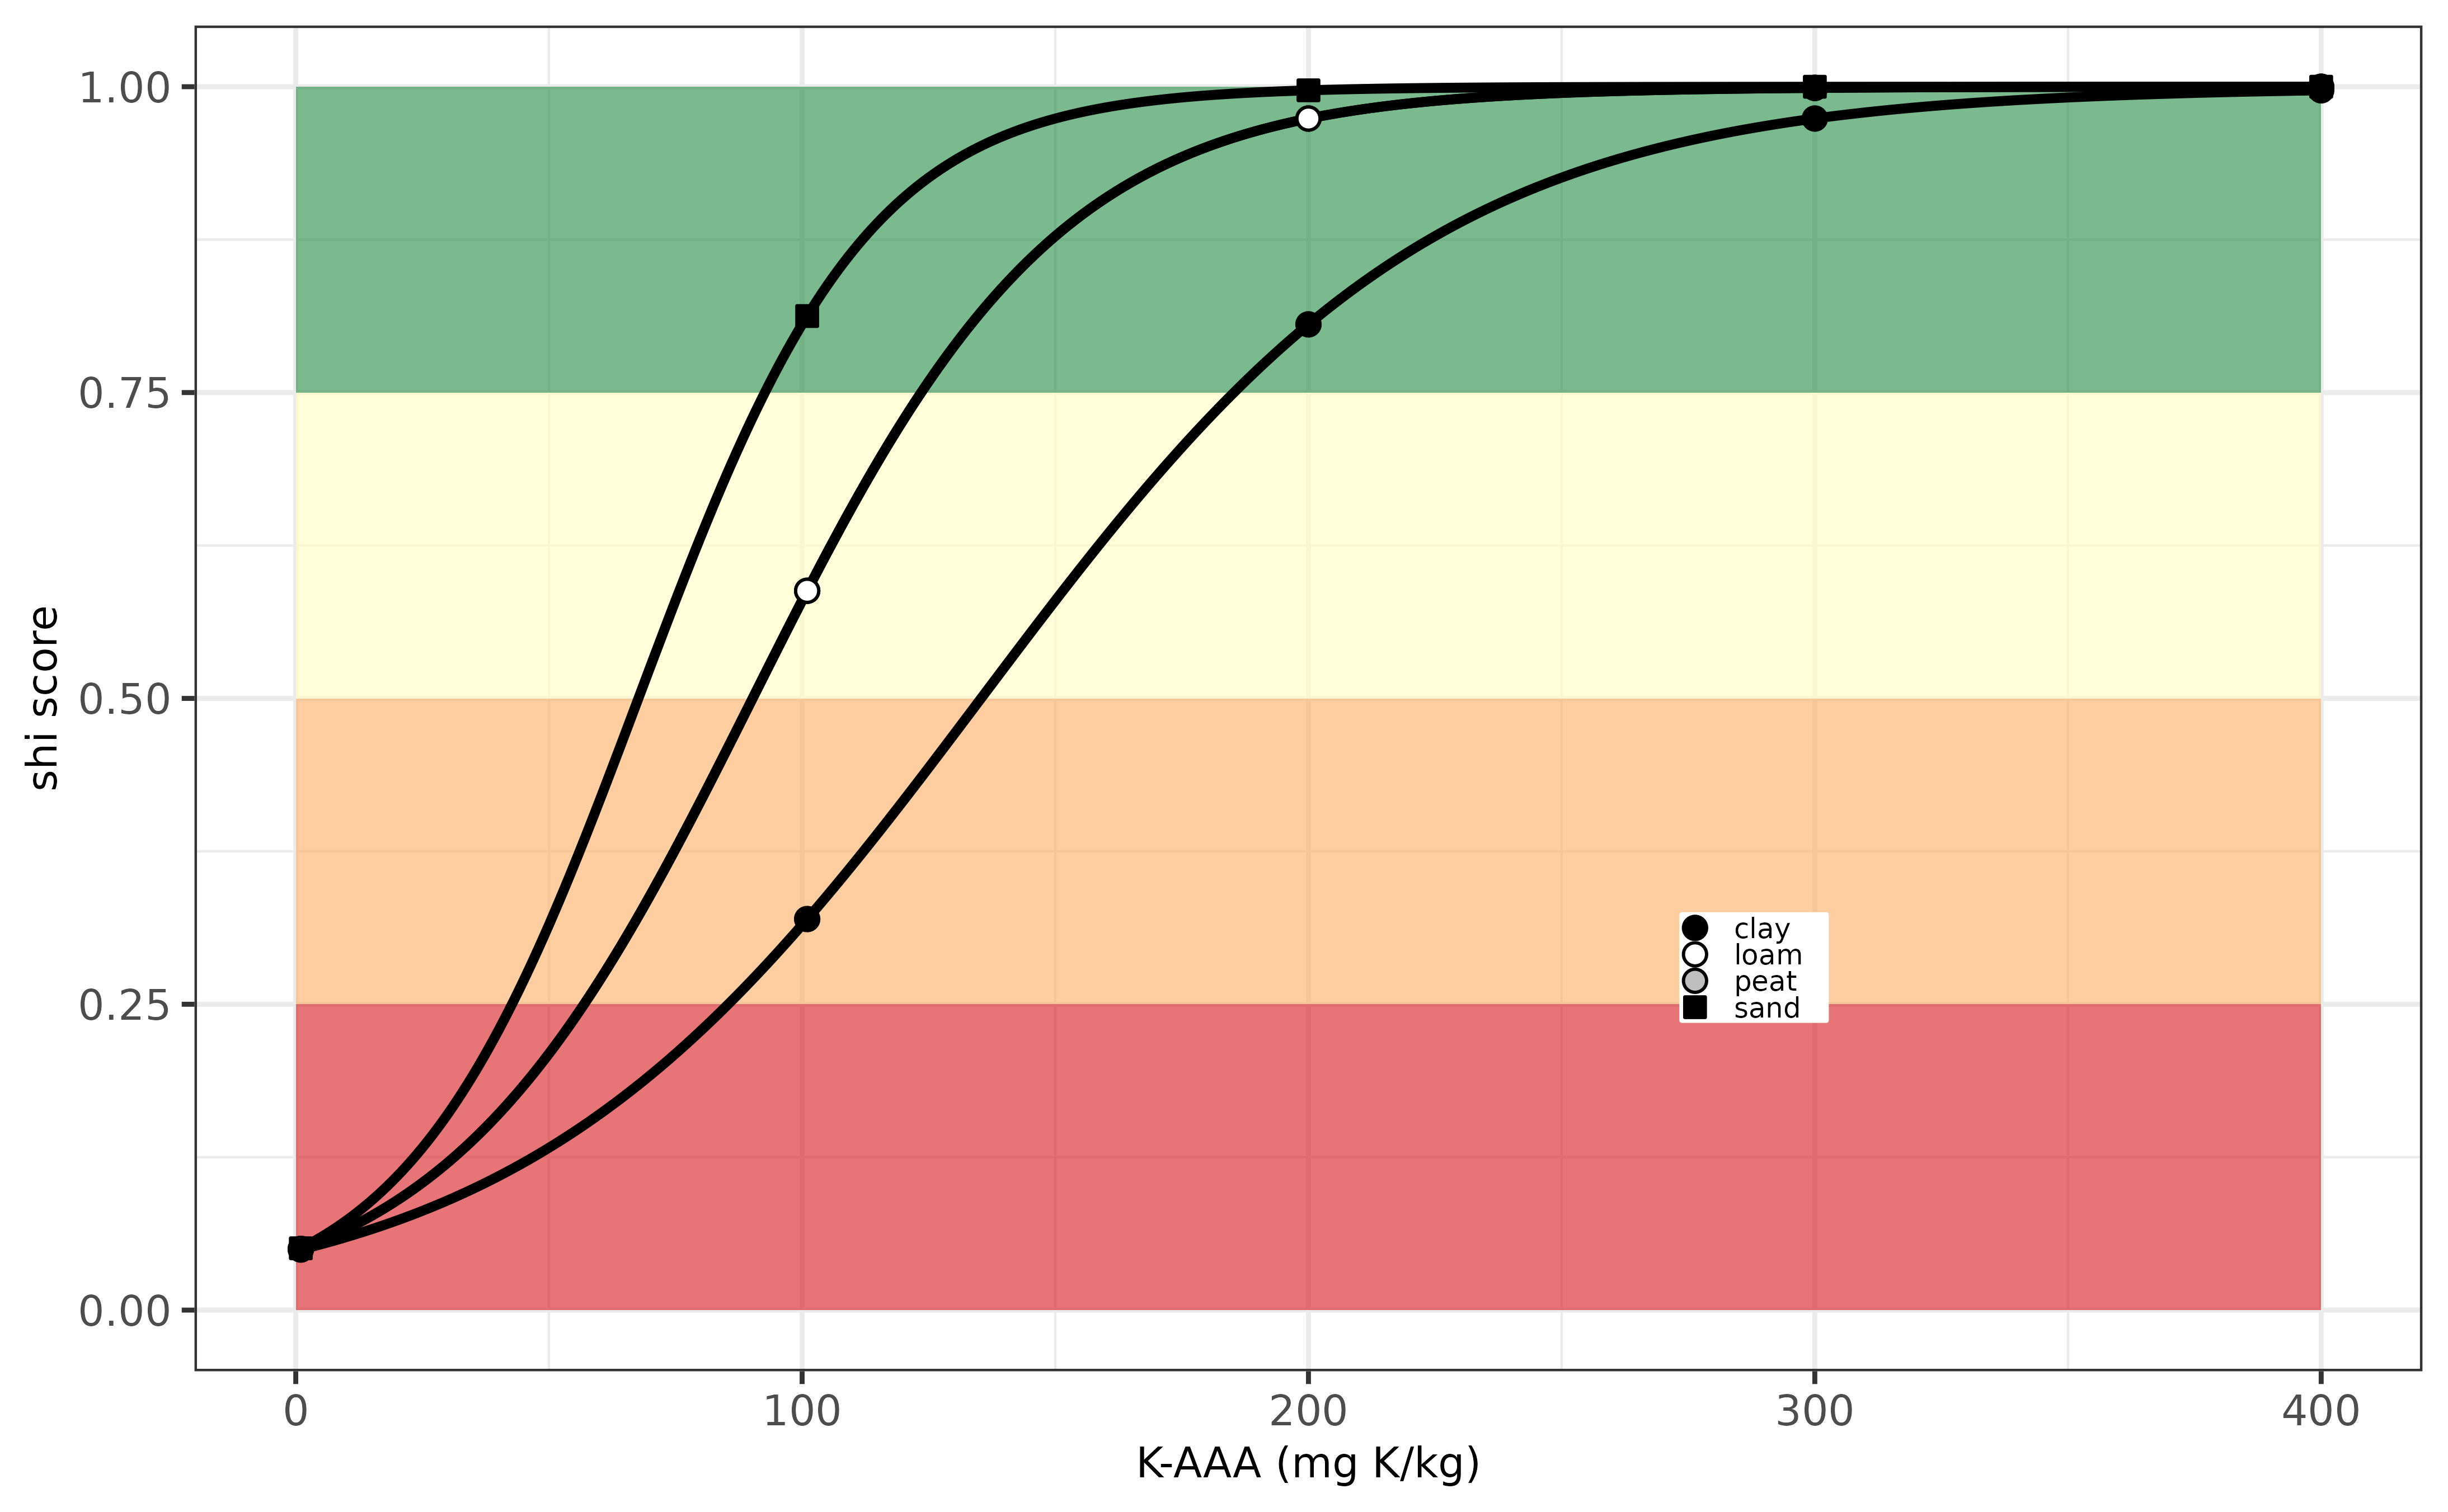
Below an example is visualized how the soil health index varies in relation to variation in K-AAA for four soil types. The differences between the loeamy and peaty soil types is rather small, whereas the biggest difference is foudn for the sandy and clay soil. The optimum soil K threshold value for sustainable crop production is around 275 mg K/ kg for the clay soil and around 175 mg K/kg for the other three soil types evaluated (i.e. sand,loam and peat). Deficiencies occur when K-AAA decreased down to 150 mg K/kg (clay) and 60-80 mg K/kg (the other soil types).
Evaluation K-indicator for Finland.
France (FR)
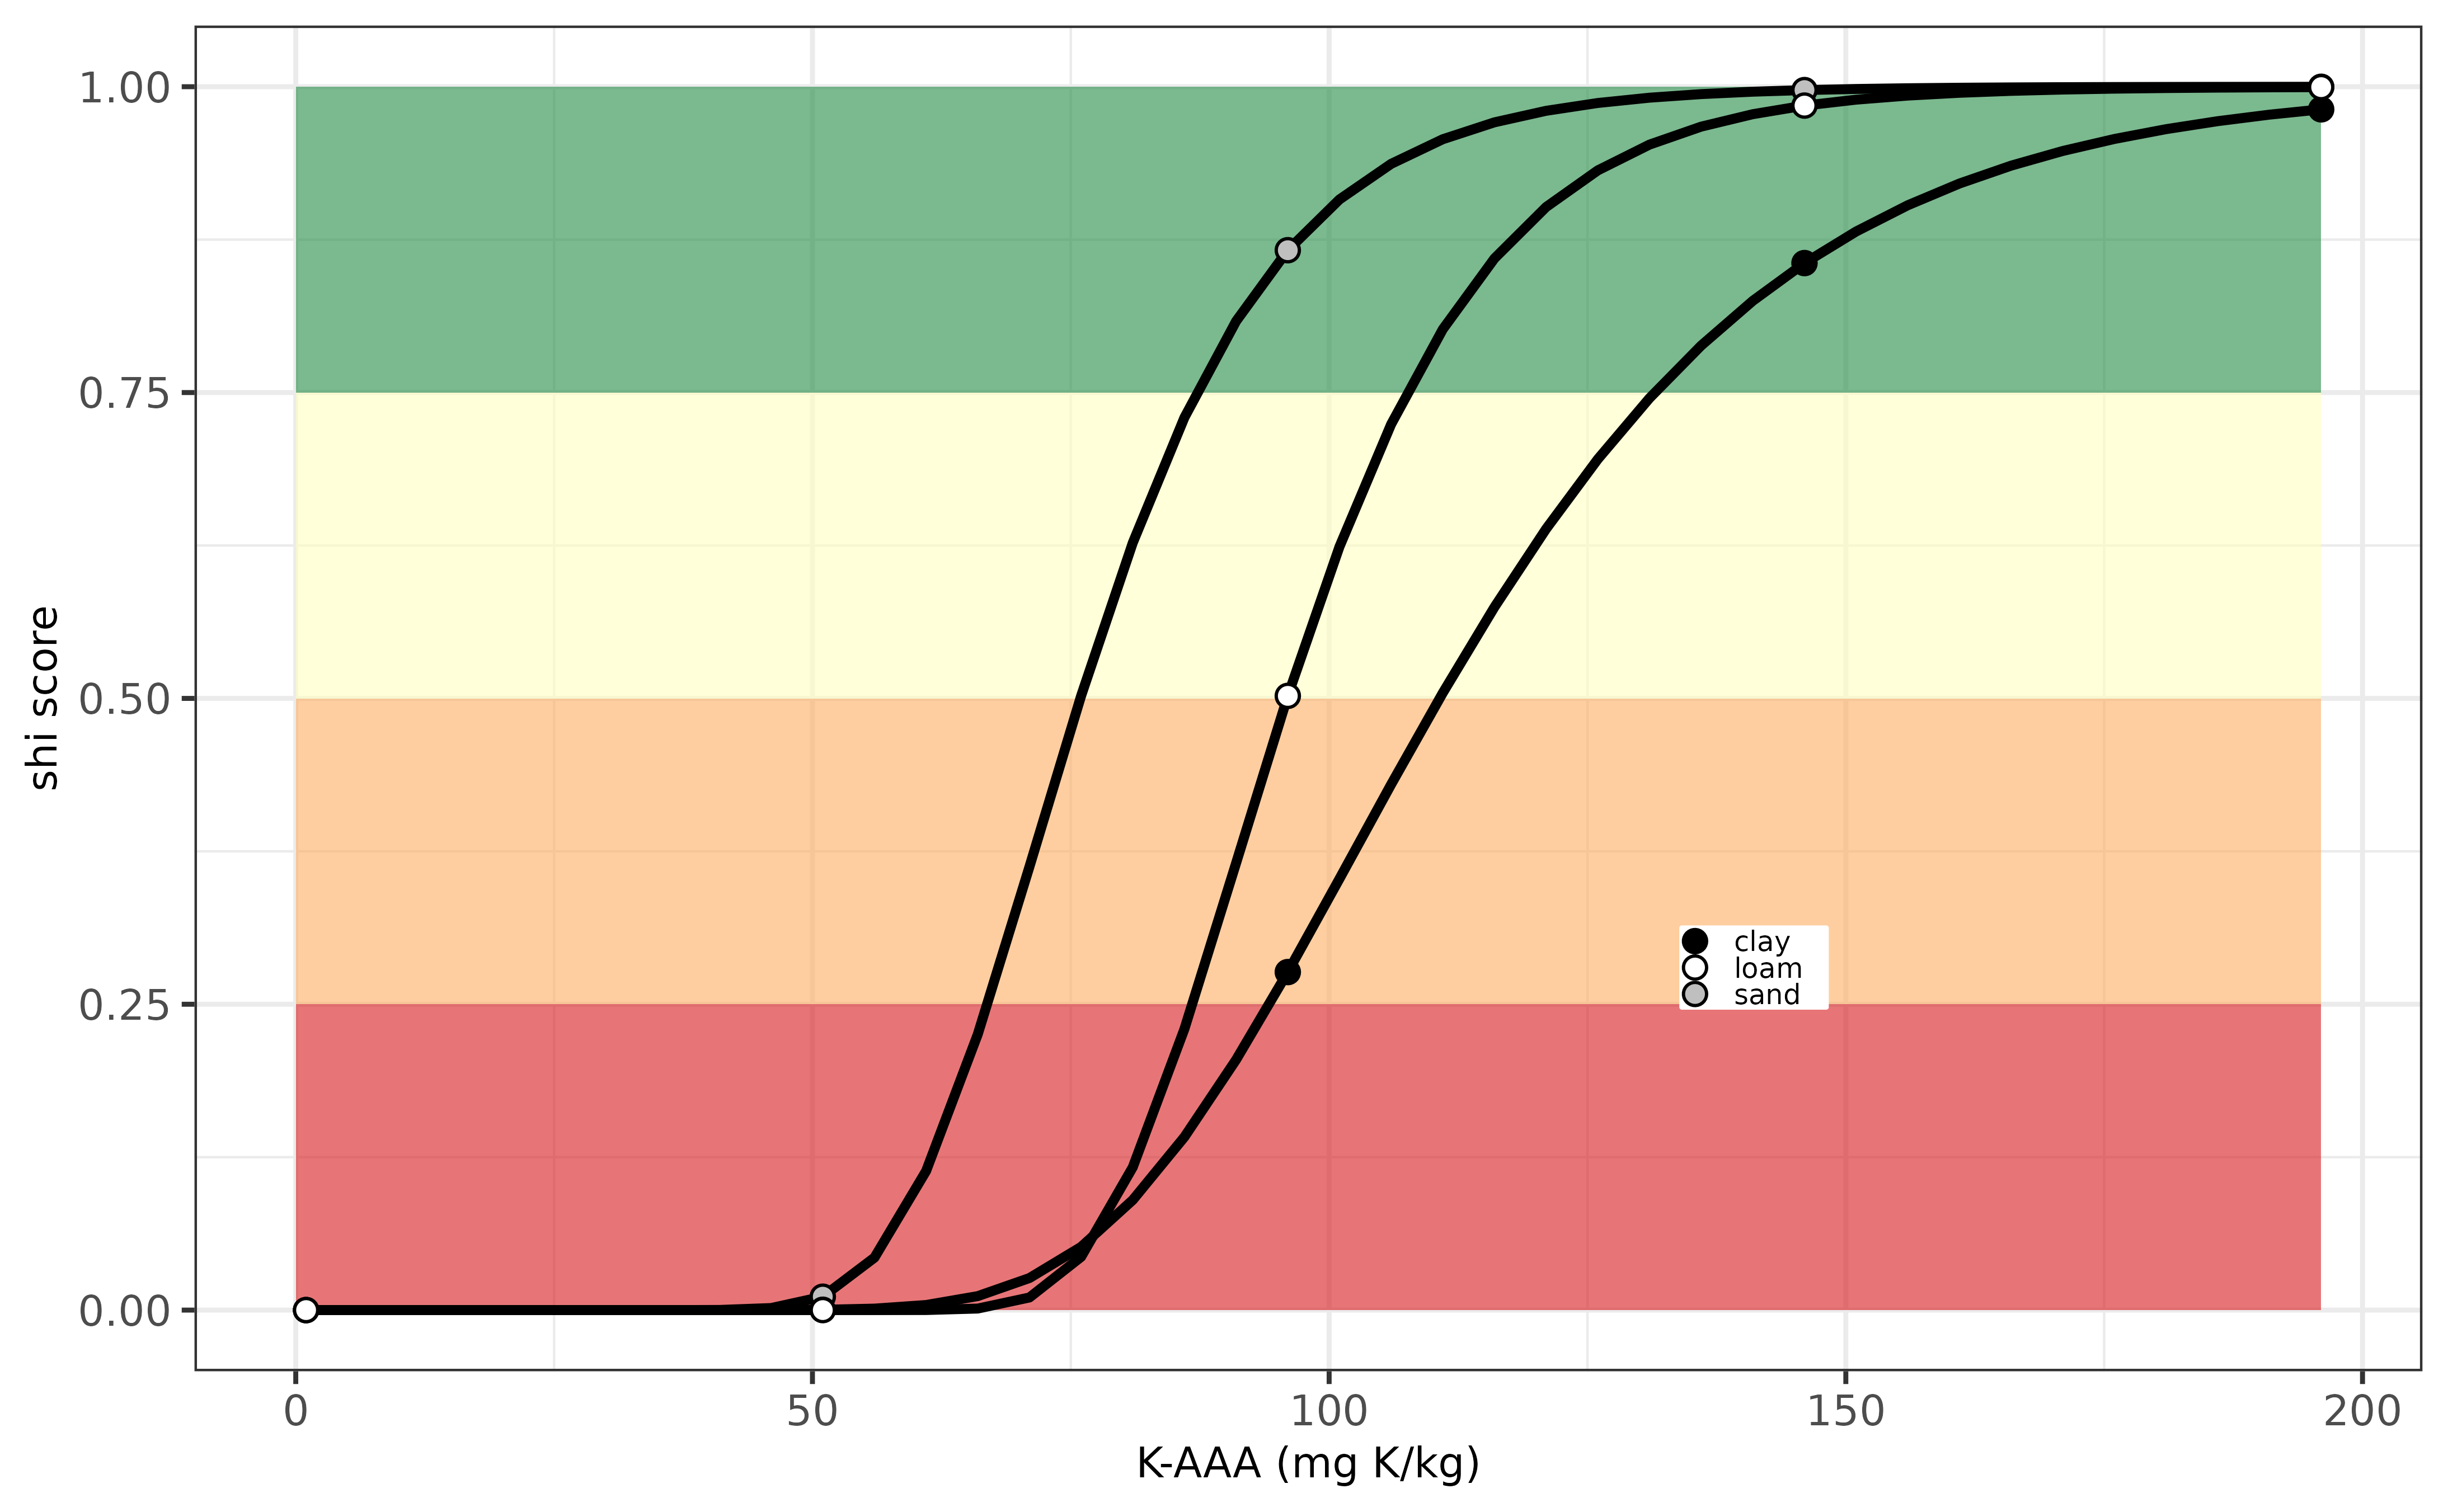
In France, soil potassium status for crop production is determined by assessing plant-available K levels, using the acid ammonium acetate excration method. This soil K pool is then compared against thresholds specific to different crops, which vary based on factors like soil type and climate. In France the K supply can be assessed with varying degree of detail depending on the availability of regional threshold values, similar to that for phosphorus. More information of the optimum threshold values and the soil K status evaluation can be found here.
The euosi package the soil health score for K supply can be
calculated with osi_c_potassium_fr, requiring the following
inputs:
- B_LU, being the French crop code, an unique code for each crop
- A_K_AAA, being the extracted K content with ammonium acetate extraction, unit mg K /kg.
- A_PH_WA, being the soil acidity measured in water.
The soil pH is used to distinghuish between calcareous and non-calcareous soils. If not given, then the function assumes the soil is not calcareous.
If one likes to adress the regional differences, it is also possible
to add the agroeconomic region in France (argument
B_AER_FR) and the agricultural soil type (argument
B_SOILTYPE_AGR). These two arguments are optional. There
are 40 soil types that can be selected (see below for the exact types
possible).
| type | type | type |
|---|---|---|
| limons battants | limons lehm | aubues legeres et champagnes superficielles |
| limons argileux | hardt superficielle - ried brun caillouteux | aubues lourdes et champagnes profondes |
| argiles | hardt profonde - ried brun caillouteux | sableux |
| cranettes | argilo-calcaires caillouteux | argileux - superficiels |
| craie | limons argileux superficiels | terre noire |
| limons | limons hydromorphes | granitique |
| argilo-calcaire | argiles hydromorphes | sologne |
| sable | sols | varenne |
| argilo-calcaire superficiels | limons sableux | gravier-diluvium |
| argilo-calcaire profonds | sable caillouteux non calcareous | limon blanc sain |
| argiles lourdes | terres | limon blanc humide |
| limons loess | limons sains et limons sableux | limon argileux sain |
| alluvions | limon caillouteux superficiels | limon argileux humide |
| NA | NA | acides limoneux ou argileux |
For more information on the possible regions, see the table below.
| region | region | region | region |
|---|---|---|---|
| nord picardie | franche-comte | haute normandie | auvergne |
| champagne ardenne | bourgogne | basse normandie | rhone alpes saone-et-loire |
| lorraine | centre limousin | bretagne pays de loire | sud quest |
| alsace | centre bassin parisien | poitou charents | auvergne |
| nord picardie | franche-comte | haute marne | rhone alpes saone-et-loire |
An example of the osi_c_potassium_fr function is
illustrated below for potato (crop code PTC) and permanent grassland
(code = PRL) for a single soil with P-content of 100 mg K / kg.
# show an example for soil K asssesment for potato crop (code = PTC) and grassland (code = PRL)
c(osi_c_potassium_fr(B_LU = 'PTC', A_K_AAA = 100,B_TEXTURE_GEPPA = 'SS'),
  osi_c_potassium_fr(B_LU = 'PRL', A_K_AAA = 100,B_TEXTURE_GEPPA = 'SS'))
## [1] 0.1674303 1.0000000
# show an example with regional information available
osi_c_potassium_fr(B_LU = 'SOJ', A_K_AAA = 100,
B_TEXTURE_GEPPA = 'SS',
B_SOILTYPE_AGR = 'limons battants',
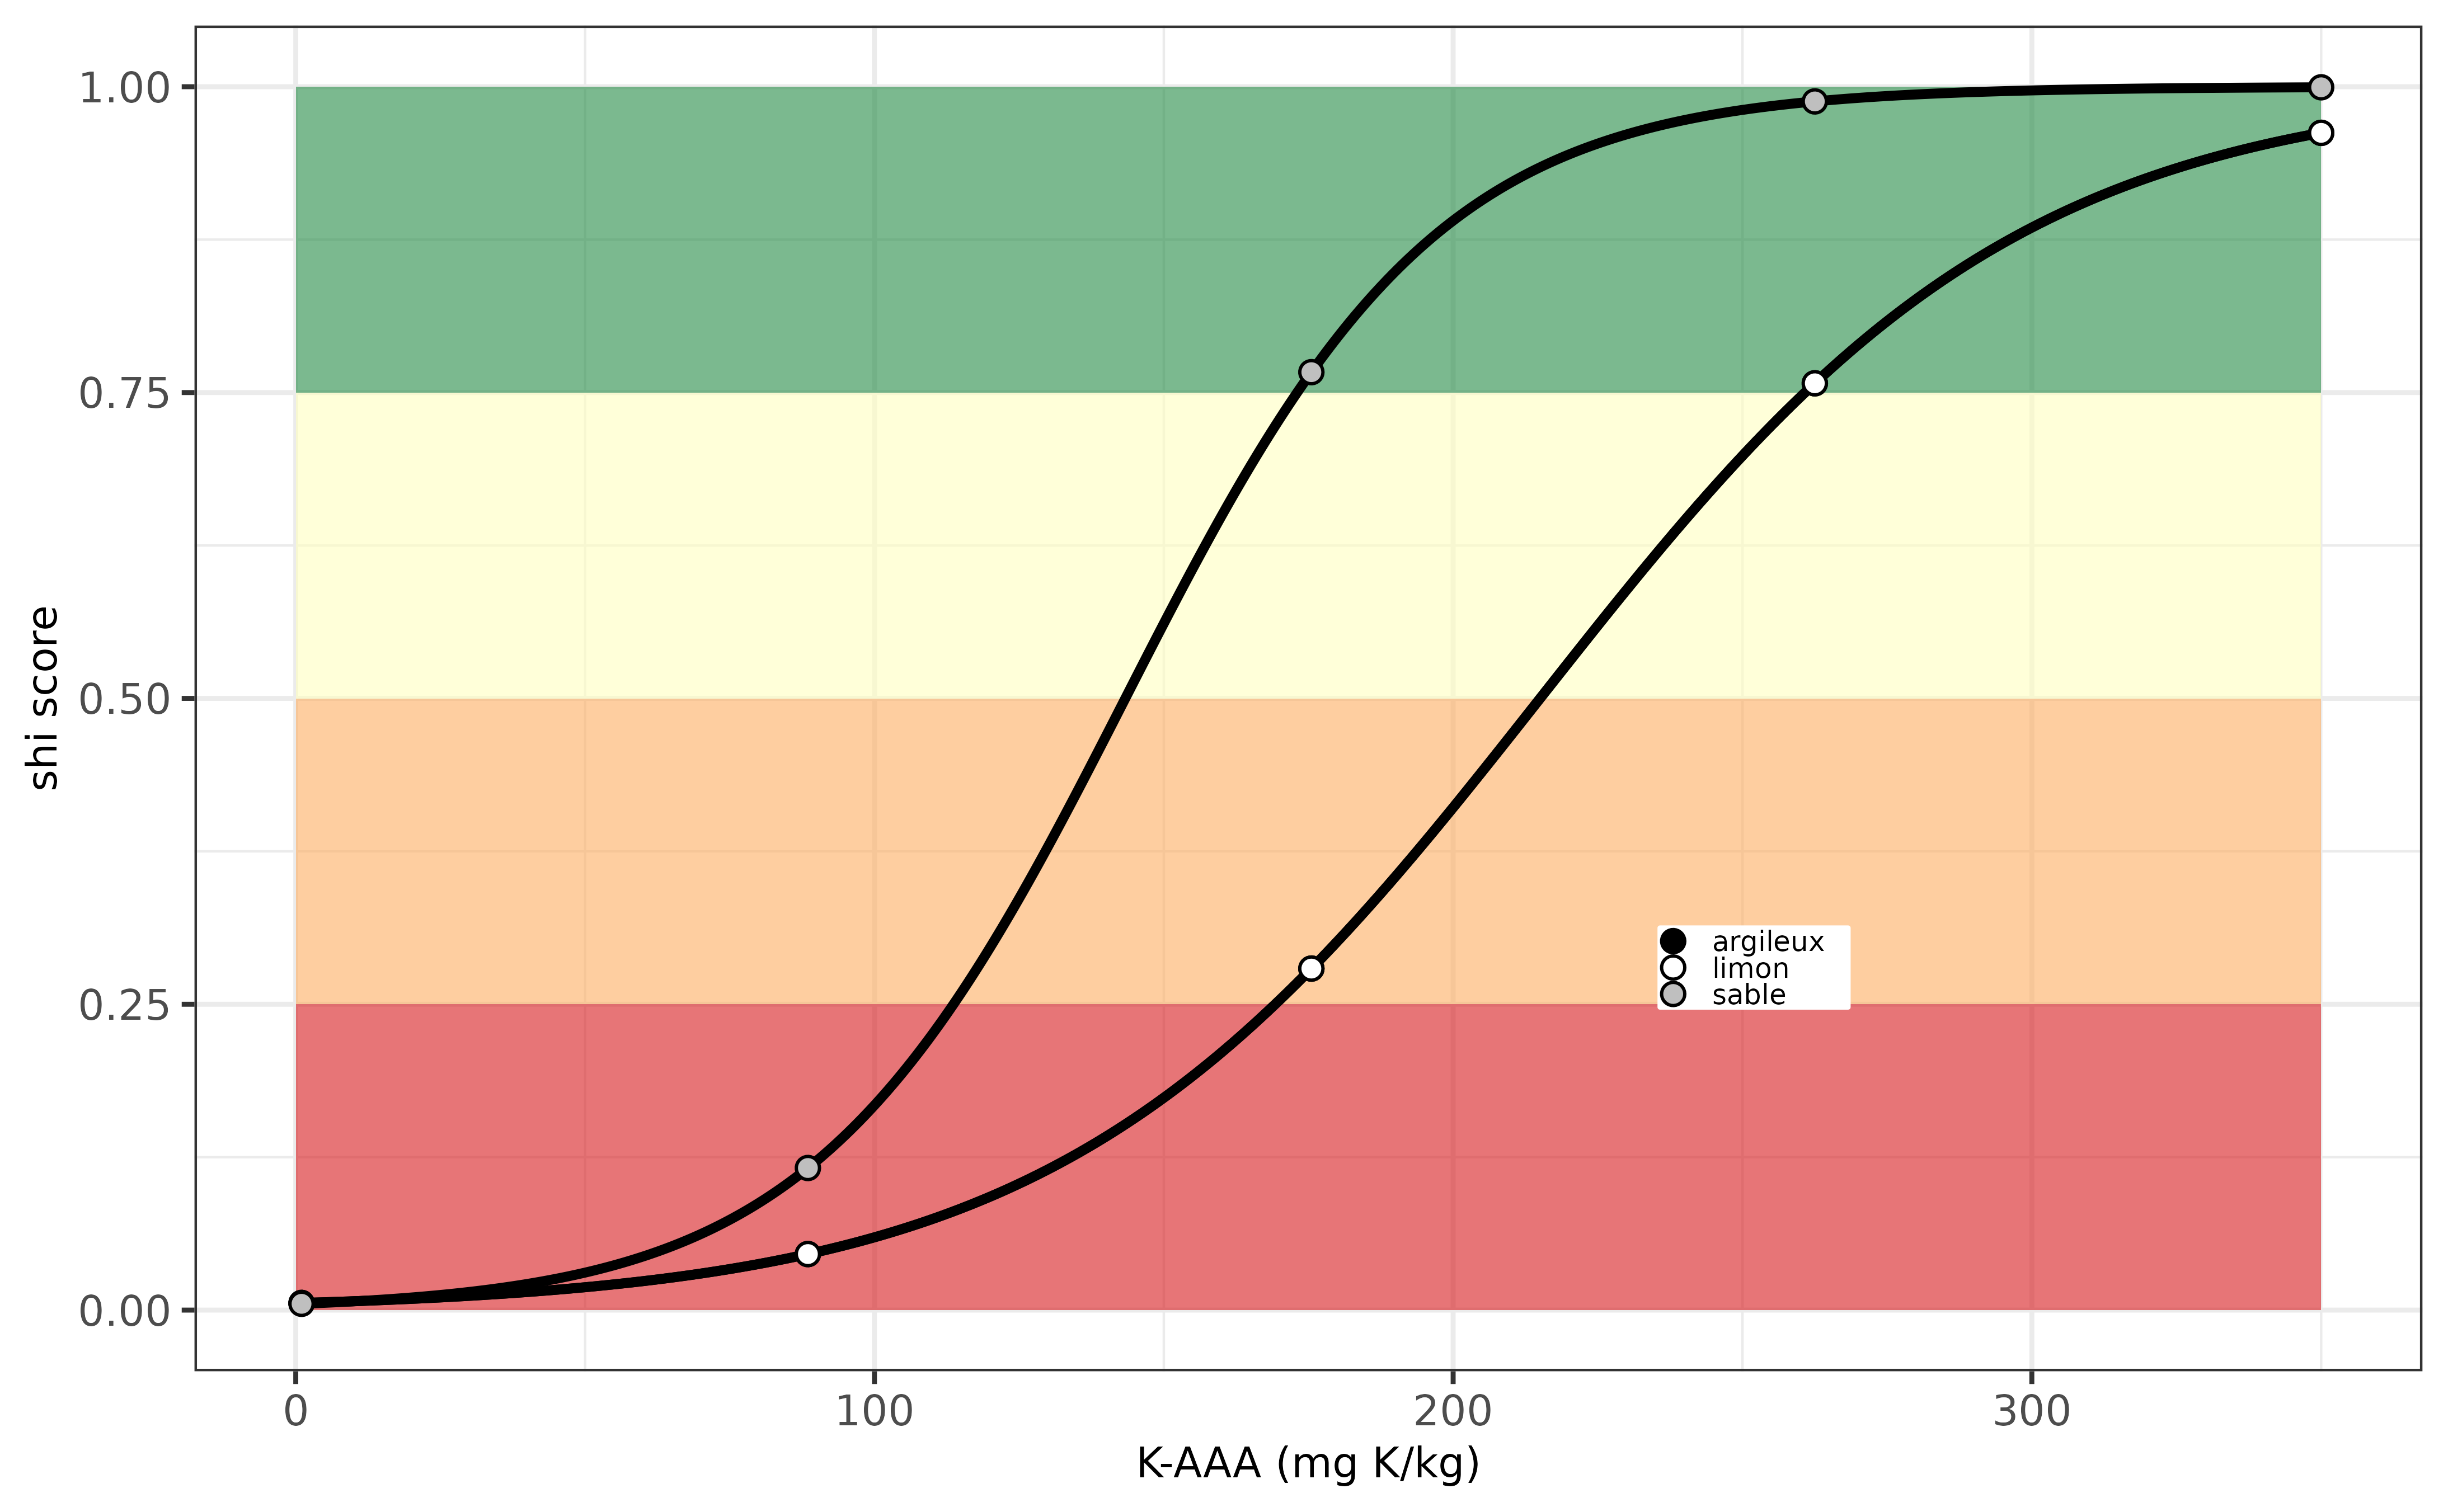
B_AER_FR = 'nord picardie')## [1] 0.9704102Below the same example but then visualised for various soil types with a K-AAA value ranging from 0 to 300 mg K per kg for a potato crop. From this example one can see that the soil health index score varies from very low to very high, depending on the content K-AAA (mg K/kg). Optimum threshold values are found for K-AAA values around 350 mg K/kg, with no differences between limon and argileux soil types, and with bigger risks for K deficiencies for the loam and clay soils (i.e. lower scores are observed already at K-AAA levels of around 200 mg K/kg).
Evaluation K-indicator for France.
Hungary (HU)
The potassium supply in view of soil health for agricultural soils in
Hungary can be calculated using osi_c_potassium_fr using
the following inputs:
- B_LU, being the crop code, an unique number for each crop
- A_SOM_LOI, being the soil organic matter content, in units percentage (%)
- A_CLAY_MI, being the clay content, in units percentage (%)
- A_CACO3_IF, being the carbonate content, in units percentage (%)
- A_K_AL, being the extracted K content with ammonium lactate, unit mg K /kg.
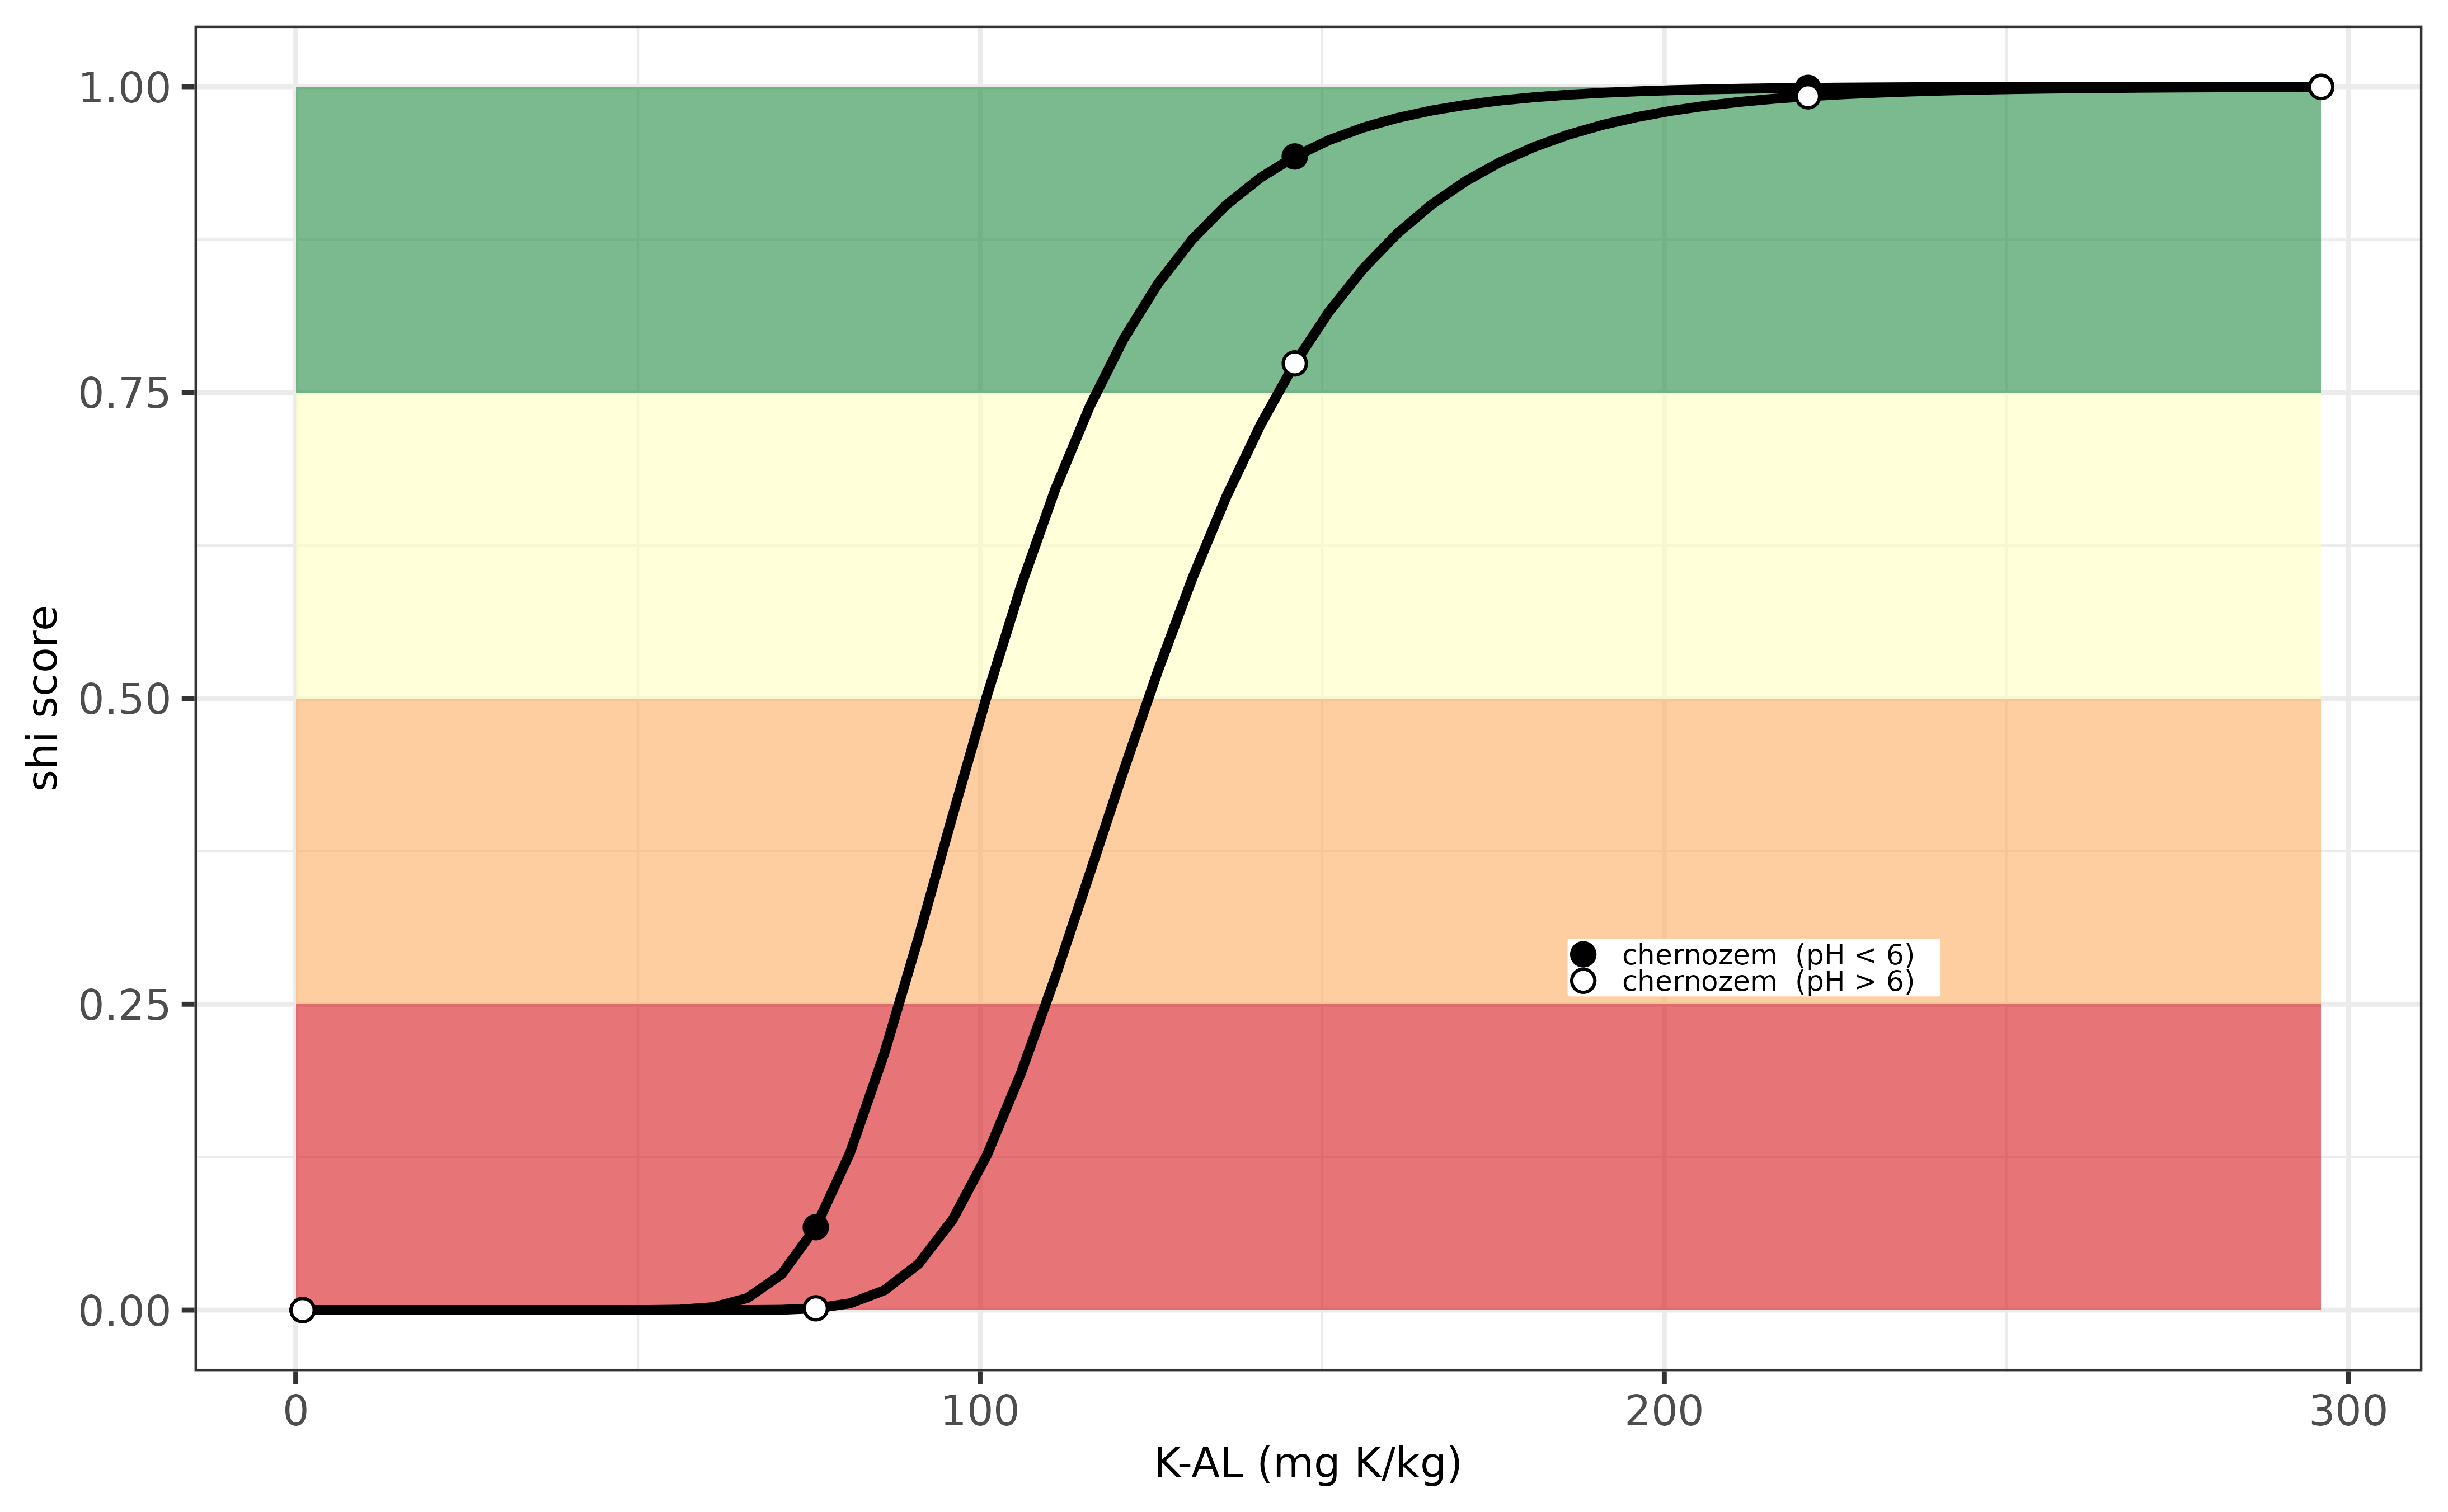
The K supplying capacity differs between carbonate and acidic soils (depending on carbonate content), between soils high or low in soil organic matter (the chernozem and other soil types), and between soils varying in soil texture (i.e. brown forest and sandys oils). Information on the threshold values for K-AL in view of sustainable crop production has been derived from Fotyma et al. (2008) who wrote a comprehensive overview of soil testing methods in Eastern Europe entitled “Soil testing methods and fertilizer recommendations in Central–Eastern European countries”.
Note that the crop codes for Hungary are not yet available in
osi_crops package table.
Below an example is visualized how the soil health index varies in relation to variation in K-AL. The optimum soil K threshold value for sustainable crop production is around 190 mg K/ kg for both soil types (peat and mineral soils), and the soil index rapidly decreases when K-AL values decreases down to 100-120 mg K/kg.
Evaluation K-indicator for Hungary.
Ireland (IE)
The potassium supply in view of soil health for agricultural soils in
Ireland can be calculated using osi_c_potassium_ie using
the following inputs:
- B_LU, being the crop code, an unique number for each crop
- A_SOM_LOI, being the soil organic matter content, in units percentage (%)
- A_K_NaAAA, being the extracted K content with Morgans solution, unit mg K /kg.
The K supplying capacity differs among soil textures, but in Ireland the evaluation of the K supply is similar for all soil types but it varies for grassland and crop land. The SOM content is used for unit conversion inside the function (since the soil evaluation system uses the so-called K-index, a number reflecting the K supply). Information on the threshold values for K-NaAAA in view of sustainable crop production can be found on the website of Teagasc
Note that the crop codes for Ireland are not yet available in
osi_crops package table.
Below an example is visualized how the soil health index varies in relation to variation in K-NaAAA. The optimum soil K-NaAAA threshold value for sustainable crop production is around 150 mg K/ kg for mineral soils and around 350 mg K/kg for peat soils. Potassium deficiency occurs when the K-NaAAA value decreases below around 150 mg K/kg for peat and below 50 mg K/kg for mineral soils.
Evaluation K-indicator for Ireland.
Italy (IT)
The potassium supply in view of soil health for agricultural soils in
Italy can be calculated using osi_c_potassium_it using the
following inputs:
- B_LU, being the crop code, an unique number for each crop
- B_TEXTURE_HYPRES, being the soil texture class according to HYPRES classification system
- A_K_AAA, being the extracted K content with acid ammonium acetate, unit mg K /kg
The K supplying capacity differ for soils varying in clay content,
and the soil health assessment differs with the texture class,
distinghuising sandy (C, arena), loamy (M, franco) and clayey
(F,arcilla) soils. One can easily classify the HYPRES texture class
using osi_get_TEXTURE_HYPRES when clay, sand and silt
content are known. The evaluation of the K supply is similar for all
land uses. Information on the threshold values for K-AAA in view of
sustainable crop could not be retreived from Italian fertilizer
guidelines (follow up action with Italian partners needed). For now,
optimum threshold values and the soil K status evaluationare taken from
the IFA report entitled
POTASSIUM AND MAGNESIUM FERTILISER RECOMMENDATIONS IN SOME EUROPEAN COUNTRIES.
Note that IACS crop codes for Italy are available in
osi_crops package table.
Below an example is visualized how the soil health index varies in relation to variation in K-AAA for three soil types (ie. clay, loam and sand). The optimum soil K threshold value for sustainable crop production is around 175 mg K/ kg for the clay soil and varies around 100-125 mg K/kg for both other soil types. Potassium deficiency occurs when the K-AAA value decreases below around 75 mg K/kg (for sand) or below around 110 mg K/kg for clay soil.
Evaluation K-indicator for Italy.
Latvia (LV)
The potassium supply in view of soil health for agricultural soils in
Latvia can be calculated using osi_c_potassium_lv using the
following inputs:
- B_LU, being the crop code, an unique number for each crop
- B_TEXTURE_USDA, being the soil texture class according to USDA classification system
- A_K_DL, being the extracted K content with Double Lactate extraction, unit mg K /kg.
The K supplying capacity differs in soils with varying textures.
Based on the soil mineralogy (clay, sand and silt content) one can
easily classify the USDA texture class using
osi_get_TEXTURE_USDA. Information on the threshold values
for K-DL in view of sustainable crop production has been derived from
Fotyma et al. (2008) who wrote a comprehensive overview of soil testing
methods in Eastern Europe entitled “Soil testing methods and fertilizer
recommendations in Central–Eastern European countries”.
Note that the crop codes for Latvia are not yet available in
osi_crops package table.
Below an example is visualized how the soil health index varies in relation to variation in K-DL. The optimum soil K threshold value for sustainable crop production is around 65 mg K/ kg for the sandy soil, and varies around 95-105 mg K/kg for the other soil types evaluated (clay and loam). Potassium deficiencies occur when the K-DL drows down below 60 mg/kg (for the clay and loam soils) or below the 35 mg K/kg for the sandy soil.

Evaluation K-indicator for Latvia.
Lithuania (LT)
The potassium supply in view of soil health for agricultural soils in
Lithuania can be calculated using osi_c_potassium_lt using
the following inputs:
- B_LU, being the crop code, an unique number for each crop
- A_SOM_LOI, being the soil organic matter content, in units percentage (%)
- A_K_AL, being the extracted K content with ammonium lactate, unit mg K /kg.
The K supplying capacity differs between peaty soils (having high levels of soil organic matter) and mineral soils. Information on the threshold values for K-AL in view of sustainable crop production has been derived from Fotyma et al. (2008) who wrote a comprehensive overview of soil testing methods in Eastern Europe entitled “Soil testing methods and fertilizer recommendations in Central–Eastern European countries”.
Note that the crop codes for Lithuania are not yet available in
osi_crops package table.
Below an example is visualized how the soil health index varies in relation to variation in K-AL. The optimum soil K threshold value for sustainable crop production is around 100 mg K/ kg for the mineral soils and is much higher (i.e. 200 mg K/kg) for the peat soil. Potassium deficiences occur therefore earlier in the mineral soils, in particular when K-AL drops down the 50 mg K/kg.
Evaluation K-indicator for Lithuania.
Netherlands (NL)
The potassium supply is strongly controlled by the distribution of K over different K pools in soil, which are regulated by sorption and desorption processes, the cation exchange capacity of the soil, and competing ions in soil solution and at the exchange complex. Building upon agronomic research done in last decades, the K supply is quantified based on the plant available K fraction (measured via CaCl2-extraction, K-CaCl2) and the CEC for grasslands, K-CaCl2 for maize fields, and K-CaCl2, CEC, clay content, organic matter content and soil pH for arable fields. The K supply is evaluated with the more-is-better logistic scoring function. More information for grasland and maize can be found here and for arable crops can be found here.
In the euosi package the K indicator for the Netherlands can be
estimated via osi_c_potassium_nl. This function requires
the following inputs:
- B_LU, being the Dutch BRP code, an unique number for each crop
- B_SOILTYPE_AGR, the agricultural soil type
- A_SOM_LOI, being the soil organic matter content, in units percentage (%)
- A_CLAY_MI, being the clay content, in units percentage (%)
- A_PH_CC, the soil pH measured in 0.01M CaCl2 (-)
- A_CEC_CO, the cation exchange capacity, measured via cohex extraction (mmol+/kg)
- A_K_CO_PO, the percentage of the CEC being occupied with K (%)
- A_K_CC, being the extracted K content with 0.01M CaCl2, unit mg K /kg.
An example is illustrated below for a maize crop (crop code 265) and a single soil is:
# show an example for maize crop
osi_c_potassium_nl(B_LU = 265, B_SOILTYPE_AGR = 'dekzand',
                  A_SOM_LOI = 4, A_CLAY_MI = 11,A_PH_CC = 5.4, A_CEC_CO = 125,
                  A_K_CO_PO = 8.5, A_K_CC = 45)
## [1] 0.3599142Below the same example but then visualised for a series of soils with a single CEC value (of 150 mmol+/kg), with 8% of the CEC being occupied with K, and a variable K-CaCl2 value (ranging from 0.1 to 150 mg K /kg). This is done for two crops: grassland and maize. From this example one can see that the soil health index score varies from very low to very high, depending on the content of K-CaCl2. It is also evident that optimum threshold values for K-CaCl2 are much higher than for grassland, for the given soil.
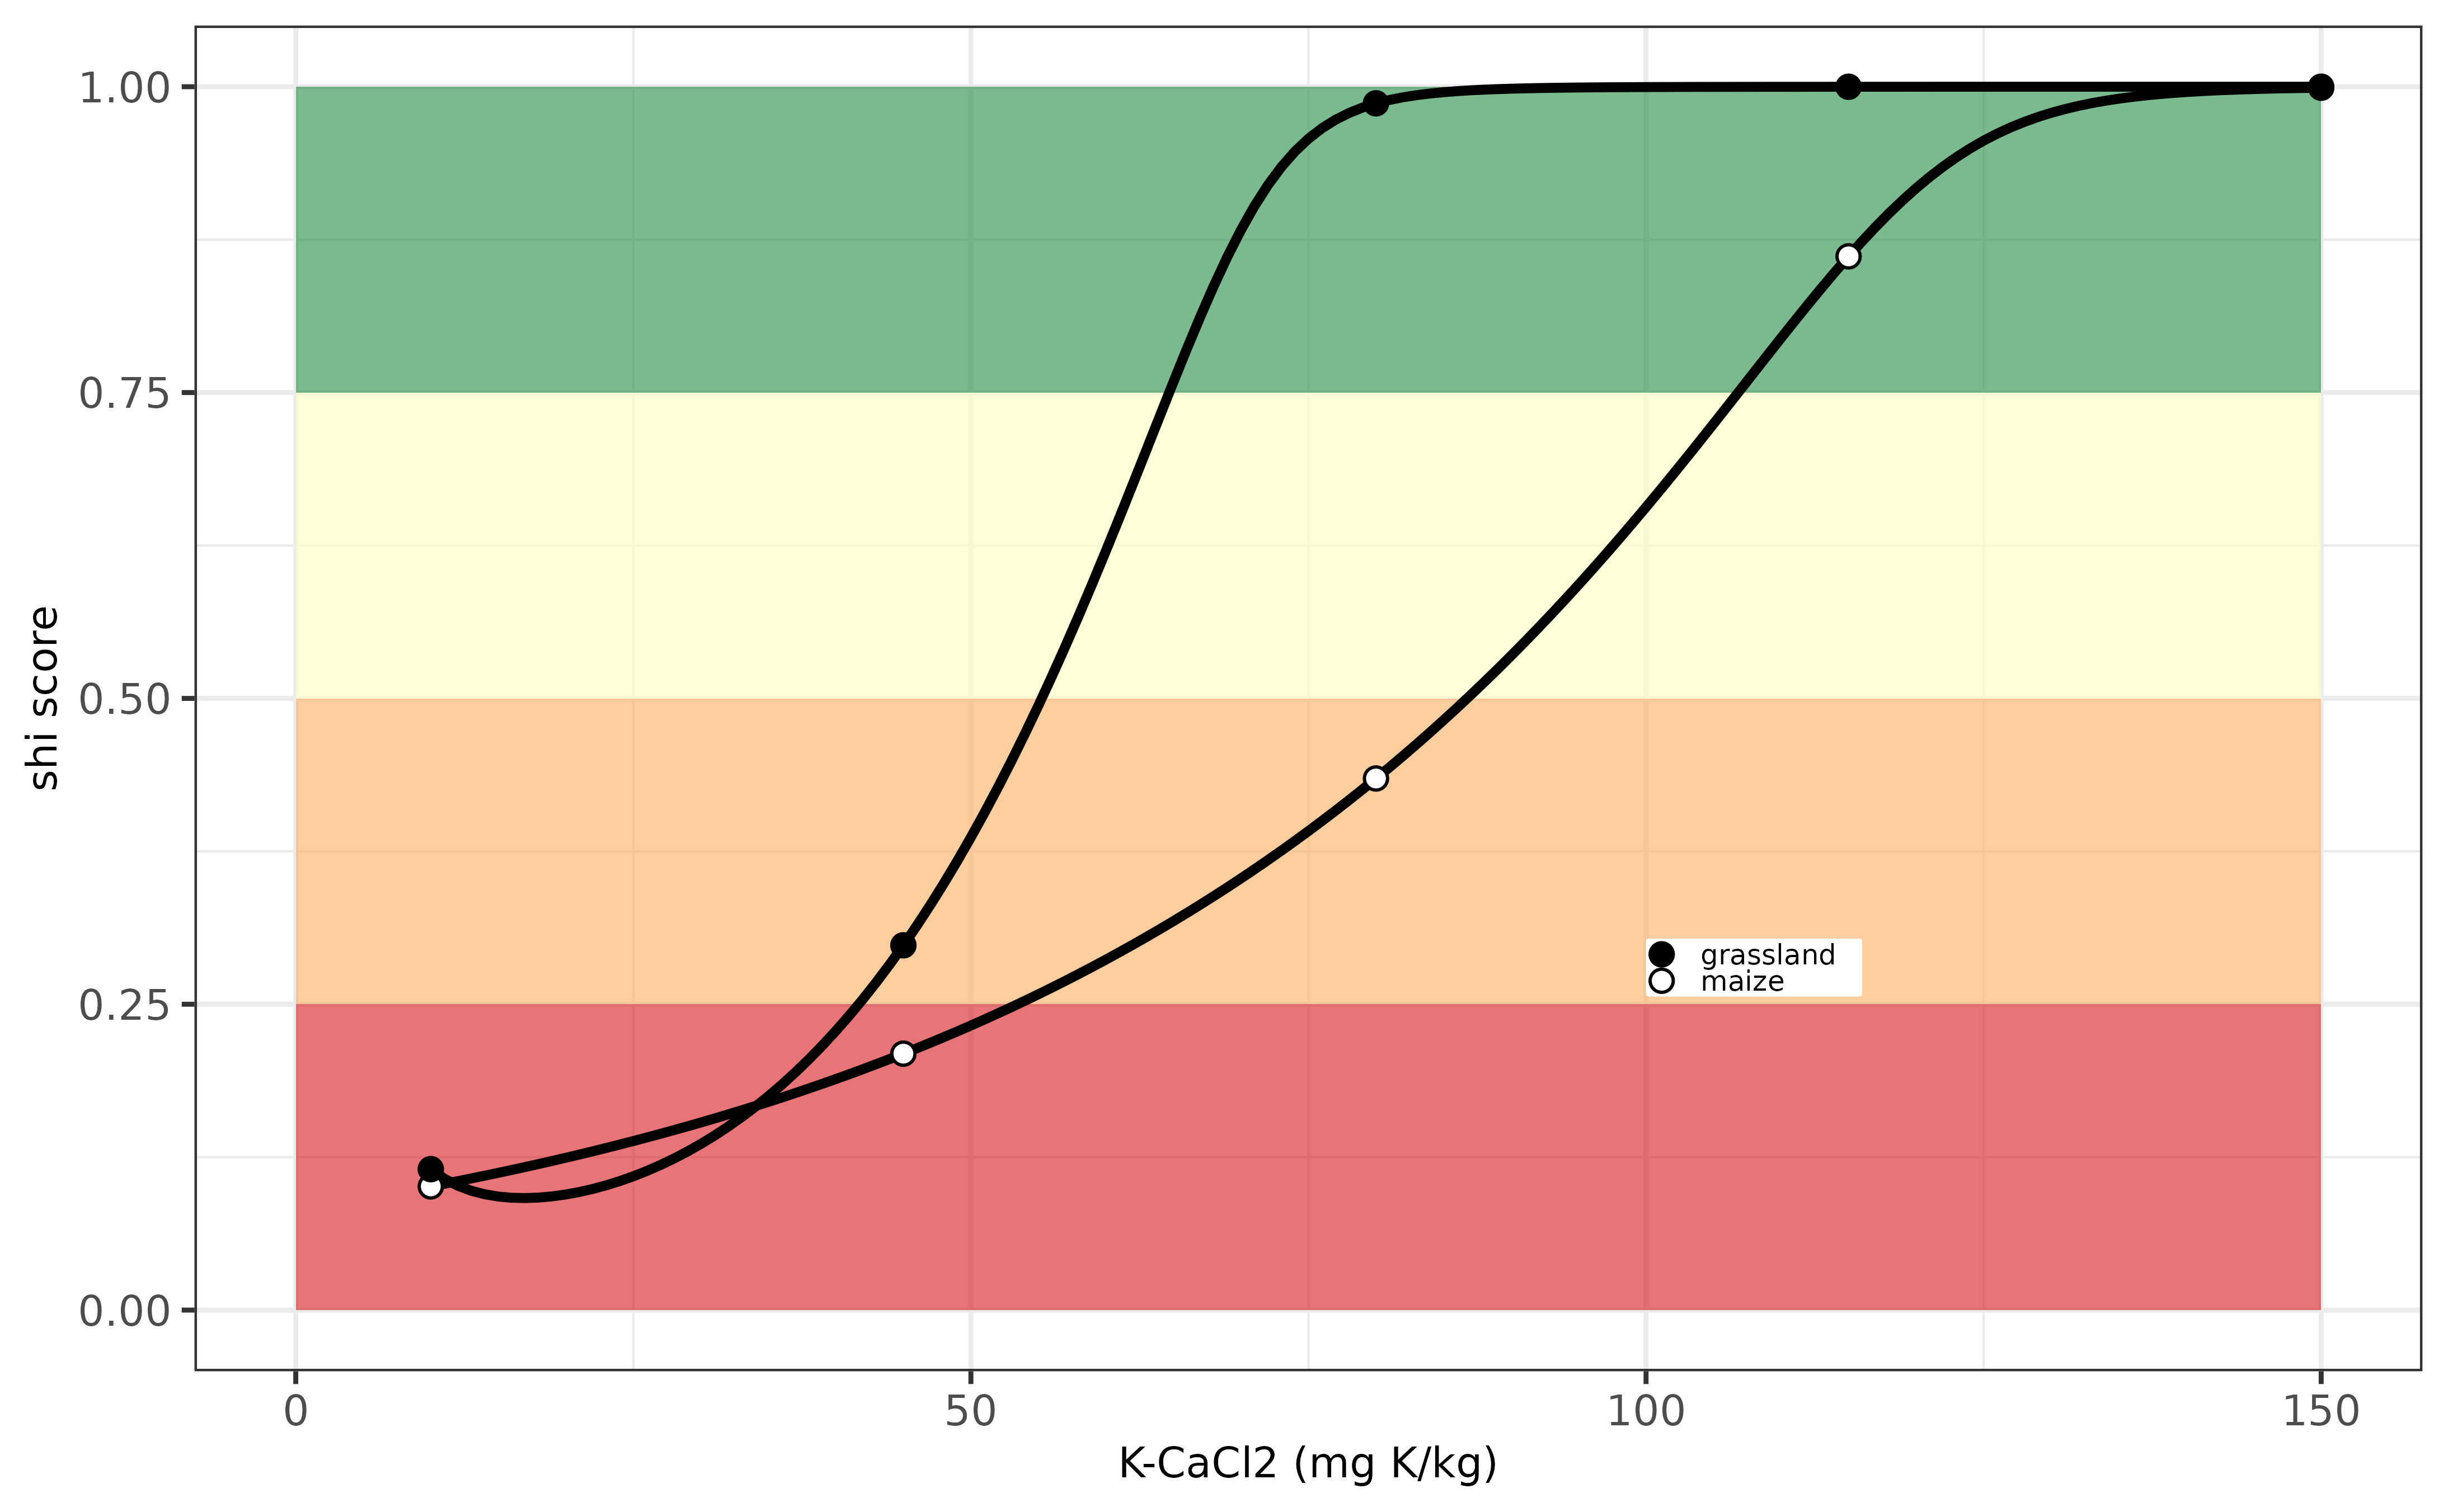
Evaluation K-indicator for the Netherlands.
Norway (NO)
The potassium supply in view of soil health for agricultural soils in
Norway can be calculated using osi_c_potassium_no using the
following inputs:
- B_LU, being the crop code, an unique number for each crop
- A_CLAY_MI, being the clay content, in units percentage (%)
- A_K_AL, being the extracted K content with ammonium lactate extraction, unit mg K /kg
The K supplying capacity differs among soil textures, but here the
evaluation of the K supply is similar for all land uses.The Norwegian
fertilizer documentation has not been retreived yet, and information of
the optimum threshold values and the soil K status evaluation was
retreived from the IFA report entitled
POTASSIUM AND MAGNESIUM FERTILISER RECOMMENDATIONS IN SOME EUROPEAN COUNTRIES.
Additional information is retreived from the website
from NIBIO.
Note that the crop codes for Norway are not yet available in
osi_crops package table.
Below an example is visualized how the soil health index varies in relation to variation in K-AL. The optimum soil K threshold value for sustainable crop production is around 150 mg K/ kg, and there is no distinction between soil types. Potassium deficiency occurs when the K-AL value decreases below around 75 mg K/kg.
Evaluation K-indicator for Norway.
Poland (PL)
The potassium supply in view of soil health for agricultural soils in
Poland can be calculated using osi_c_potassium_pl using the
following inputs:
- B_LU, being the crop code, an unique number for each crop
- B_TEXTURE_HYPRES, being the soil texture class according to HYPRES classification system
- A_K_DL, being the extracted K content with Double Lactate extraction, unit mg K /kg.
The K supplying capacity differ for soils varying in clay content,
and the soil health assessment differs with the texture class,
distinghuising sandy (C), loamy (M) and clayey (F) soils, for example.
One can easily classify the HYPRES texture class using
osi_get_TEXTURE_HYPRES when clay, sand and silt content are
known.
Information on the threshold values for K-DL in view of sustainable crop production has been derived from Fotyma et al. (2008) who wrote a comprehensive overview of soil testing methods in Eastern Europe entitled “Soil testing methods and fertilizer recommendations in Central–Eastern European countries”.
Note that the crop codes for Poland are not yet available in
osi_crops package table.
Below an example is visualized how the soil health index varies in relation to variation in K-DL for three soil types. The optimum soil K threshold value for sustainable crop production is strongly dependent on soil type, ranging from around 75 mg K/kg for sandy soils up to 150 mg K/kg for clayey and loamy soils. Potassium deficiencies range accordingly between 35 and 100 mg K/kg.
Evaluation K-indicator for Poland.
Portugal (PT)
The potassium supply in view of soil health for agricultural soils in
Portugal can be calculated using osi_c_potassium_pt using
the following inputs:
- B_LU, being the crop code, an unique number for each crop
- A_K_AAA, being the extracted K content with acid ammonium acetate, unit mg K /kg
Information on the threshold values for K-AAA in view of sustainable
crop production has been derived from the Portugese fertilizer manual
entitled Manual de fertilização das culturas, a document
that can be downloaded here.
Note that IACS crop codes for Portugal are available in
osi_crops package table.
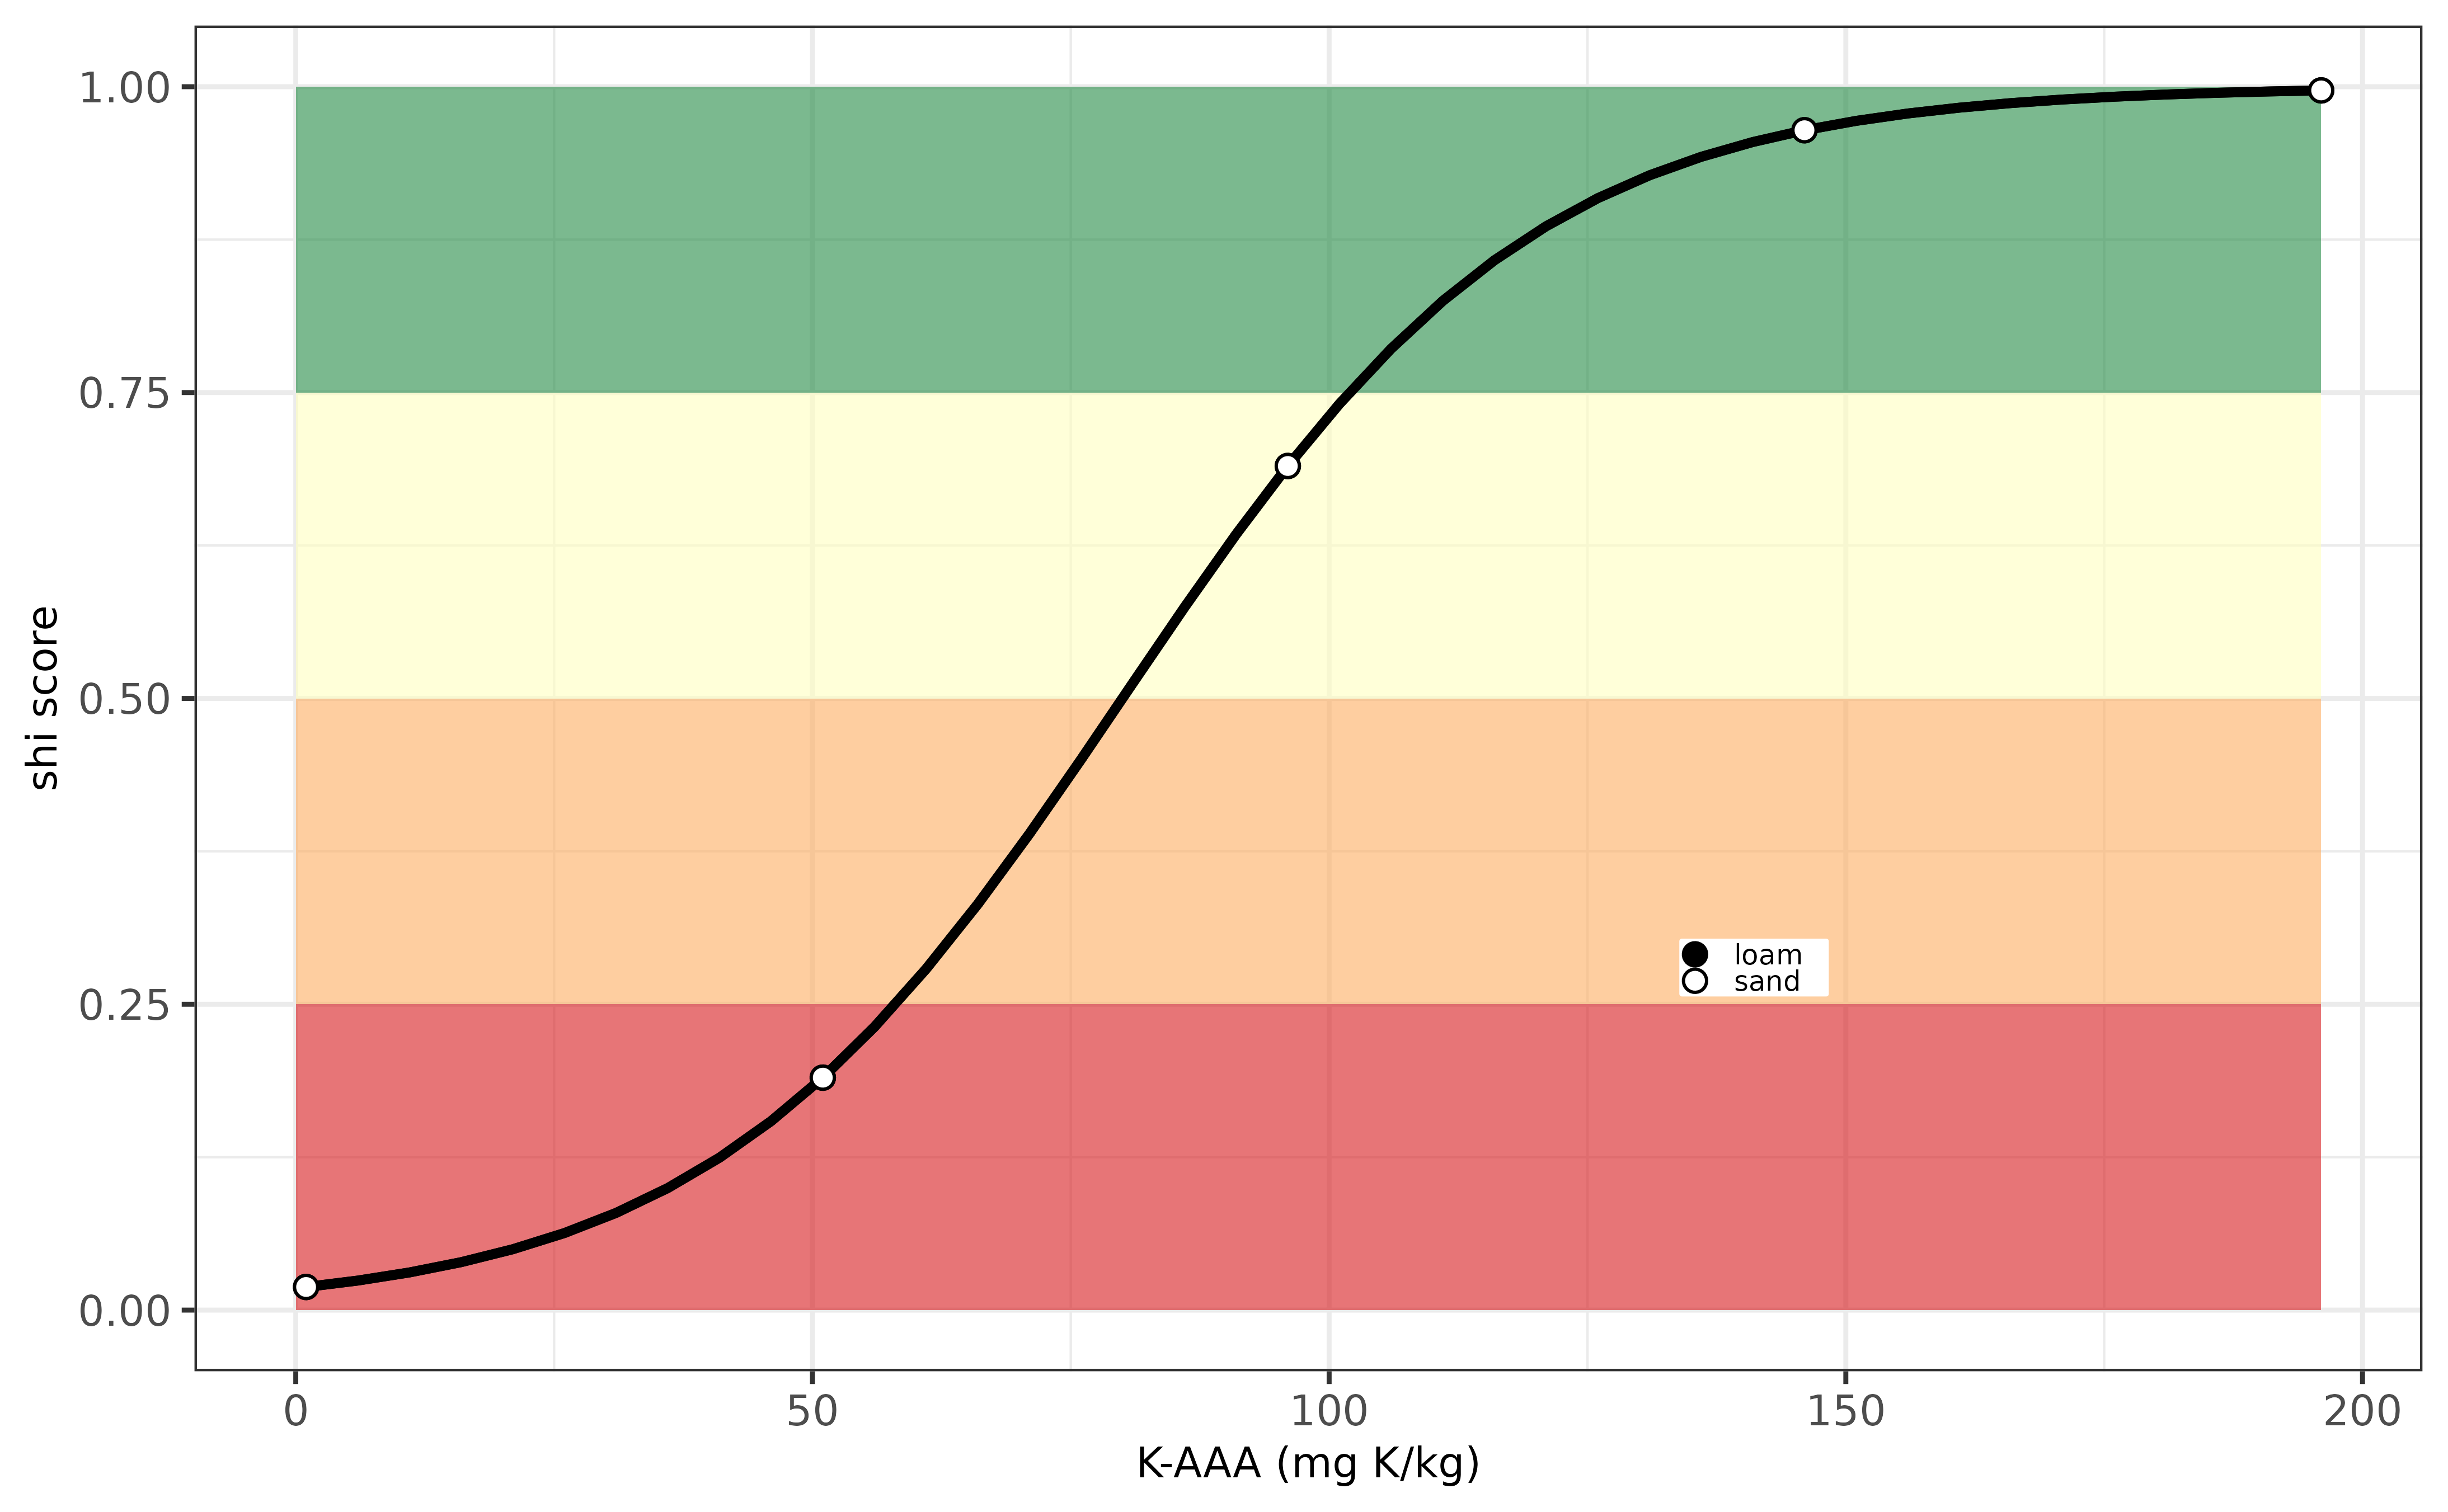
Below an example is visualized how the soil health index varies in relation to variation in K-AAA. The optimum soil K threshold value for sustainable crop production is around 60 mg K/ kg, and the soil index decreases when K_AAA values decreases down to 30 mg K/kg. There is no differntiation among soil types of land uses.
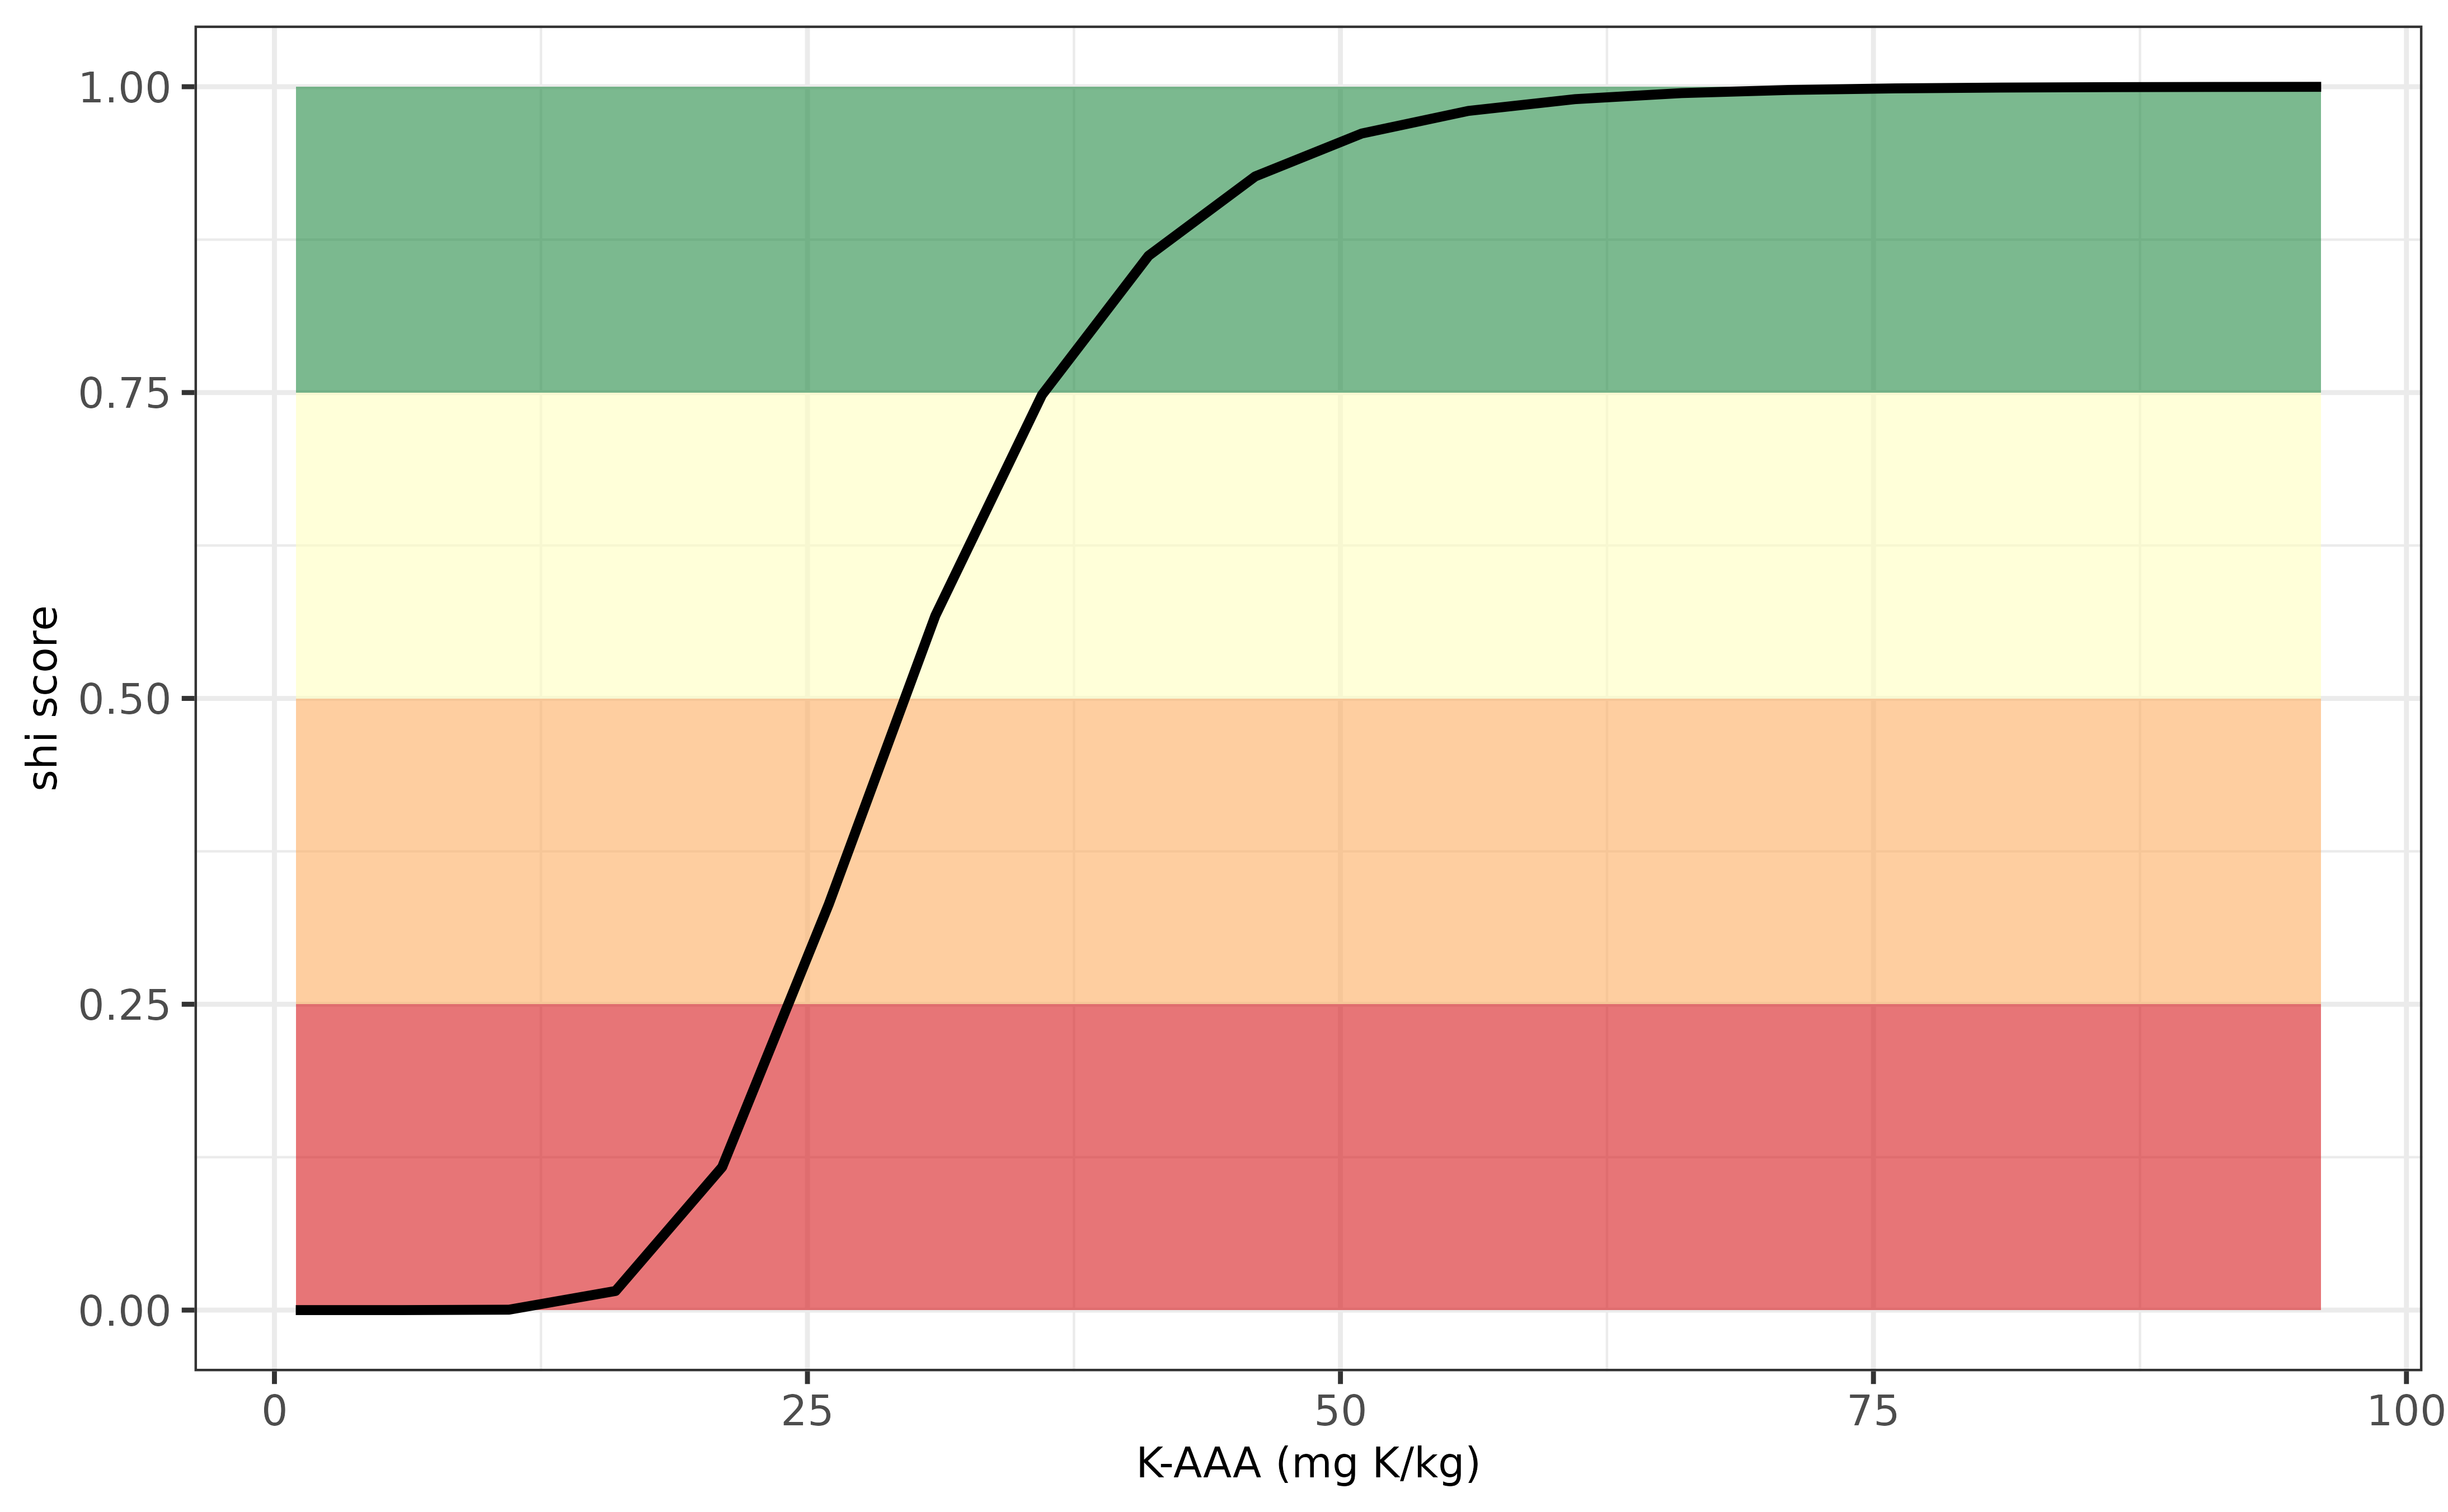
Evaluation P-indicator for Portugal.
Romenia (RO)
The potassium supply in view of soil health for agricultural soils in
Romenia can be calculated using osi_c_potassium_ro using
the following inputs:
- B_LU, being the crop code, an unique number for each crop
- B_TEXTURE_HYPRES, being the soil texture class according to HYPRES classification system
- A_K_AL, being the extracted K content with Ammonium Acetate Lacate, unit mg K /kg.
The K supplying capacity differs in soils with varying textures.
Based on the soil mineralogy (clay, sand and silt content) one can
easily classify the HYPRES texture class using
osi_get_TEXTURE_HYPRES.Information on the threshold values
for K-AL in view of sustainable crop production has been derived from
the Romenia document entitled
SISTEME DE CULTURI ŞI PLANURI DE FERTILIZARE, a document
that can be downloaded here.
Note that the crop codes for Romenia are not yet available in
osi_crops package table.
Below an example is visualized how the soil health index varies in relation to variation in K-AL. The optimum soil K threshold value for sustainable crop production is around 200 mg K/ kg, and the soil index decreases when K-AL values decreases. Potassium deficiency occurs when K-AL is below 100 mg /kg for the clay soil and below the 50 mg K/kg for the sandy soil. There is no differentiation among land uses.
Evaluation P-indicator for Romenia.
Sweden (SE)
The potassium supply in view of soil health for agricultural soils in
Sweden can be calculated using osi_c_potassium_se using the
following inputs:
- B_LU, being the crop code, an unique number for each crop
- A_K_AL, being the extracted K content with ammonium lactate extraction, unit mg K /kg
The K supplying capacity differs per land use type. The threshold values for optimum crop production were derived from the fertilizer guidelines “Rekommendationer för gödsling och kalkning 2025”.
Note that IACS crop codes for Sweden are available in
osi_crops package table.
Below an example is visualized how the soil health index varies in relation to variation in K-AL. The soil health assessment does not differentiate (yet) between crop types and has an optimum threshold around 100 mg K/kg. Potassium deficiency occurs when the K-AL values decrease below 60 mg K/kg.
Evaluation K-indicator for Sweden.
Slovak Republic (SK)
The potassium supply in view of soil health for agricultural soils in
Slovak Republic can be calculated using osi_c_potassium_sk
using the following inputs:
- B_LU, being the crop code, an unique number for each crop
- B_TEXTURE_HYPRES, being the soil texture class according to HYPRES classification system
- A_K_M3, being the extracted K content with Mehlich-III extraction, unit mg K /kg.
The K supplying capacity differs in soils with varying textures.
Based on the soil mineralogy (clay, sand and silt content) one can
easily classify the USDA texture class using
osi_get_TEXTURE_HYPRES. Information on the threshold values
for K-Mehlich in view of sustainable crop production has been derived
from Fotyma et al. (2008) who wrote a comprehensive overview of soil
testing methods in Eastern Europe entitled “Soil testing methods and
fertilizer recommendations in Central–Eastern European countries”.
Note that IACS crop codes for Slovak Republic are available in
osi_crops package table.
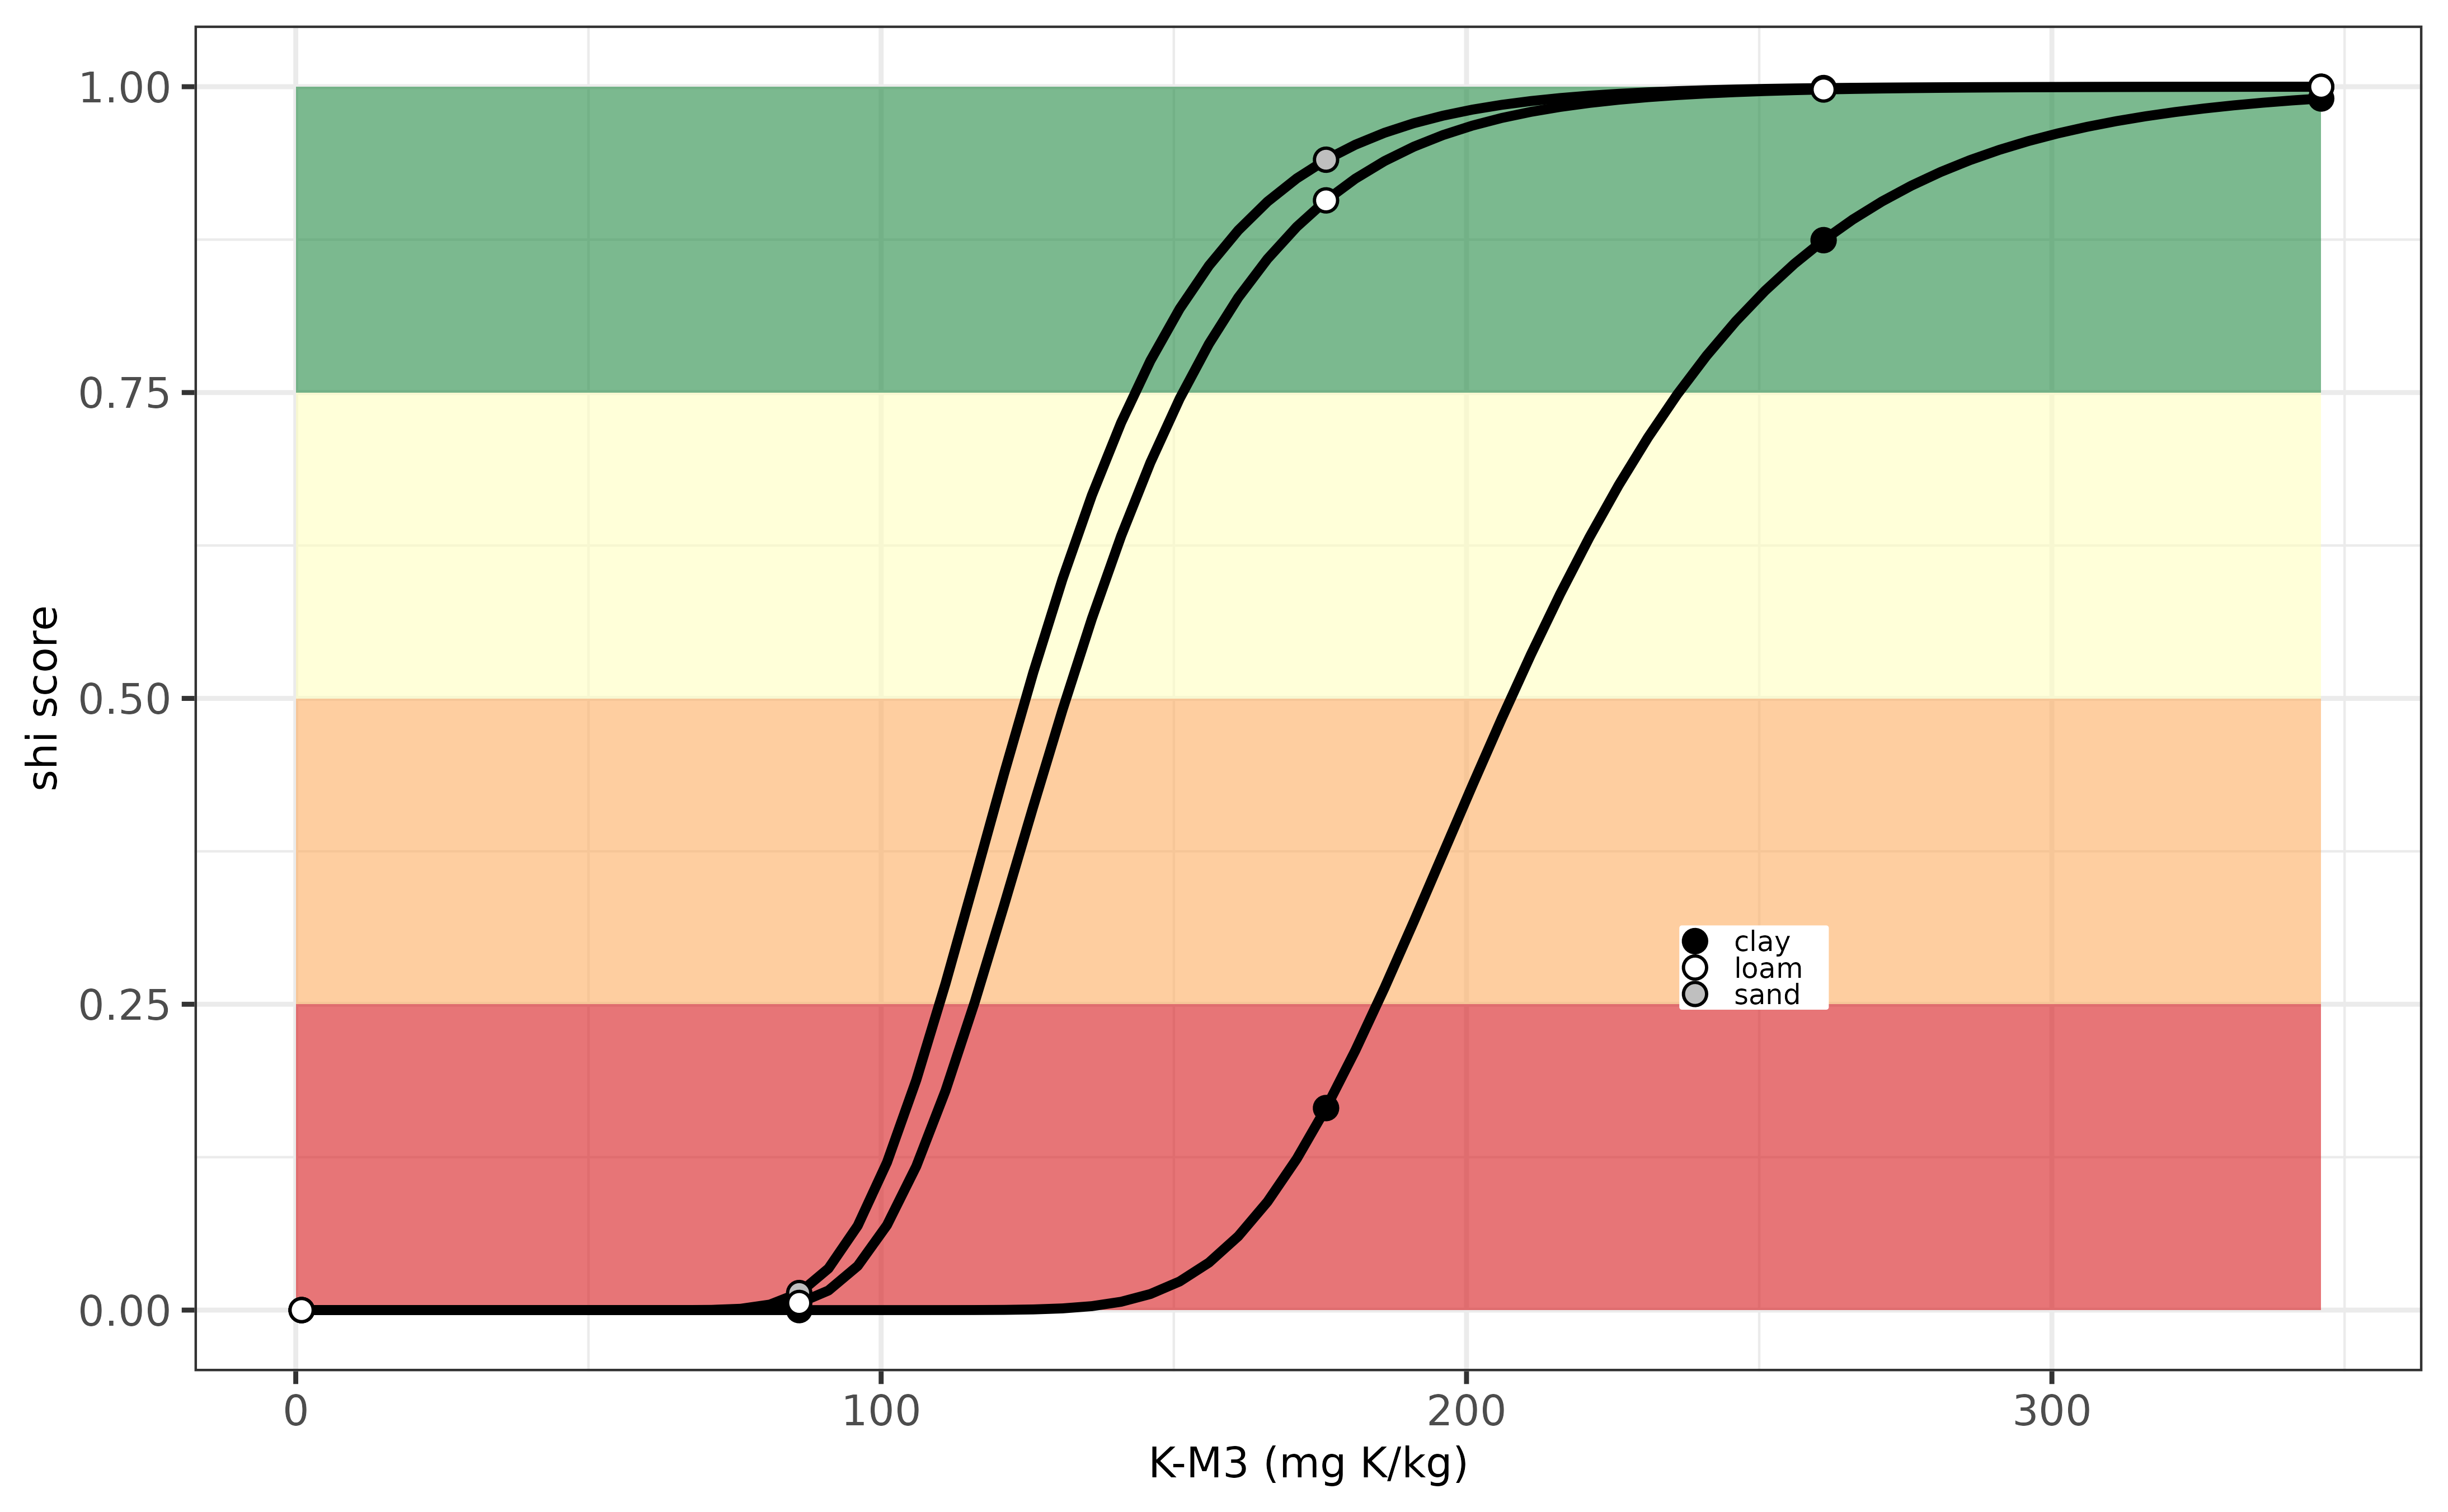
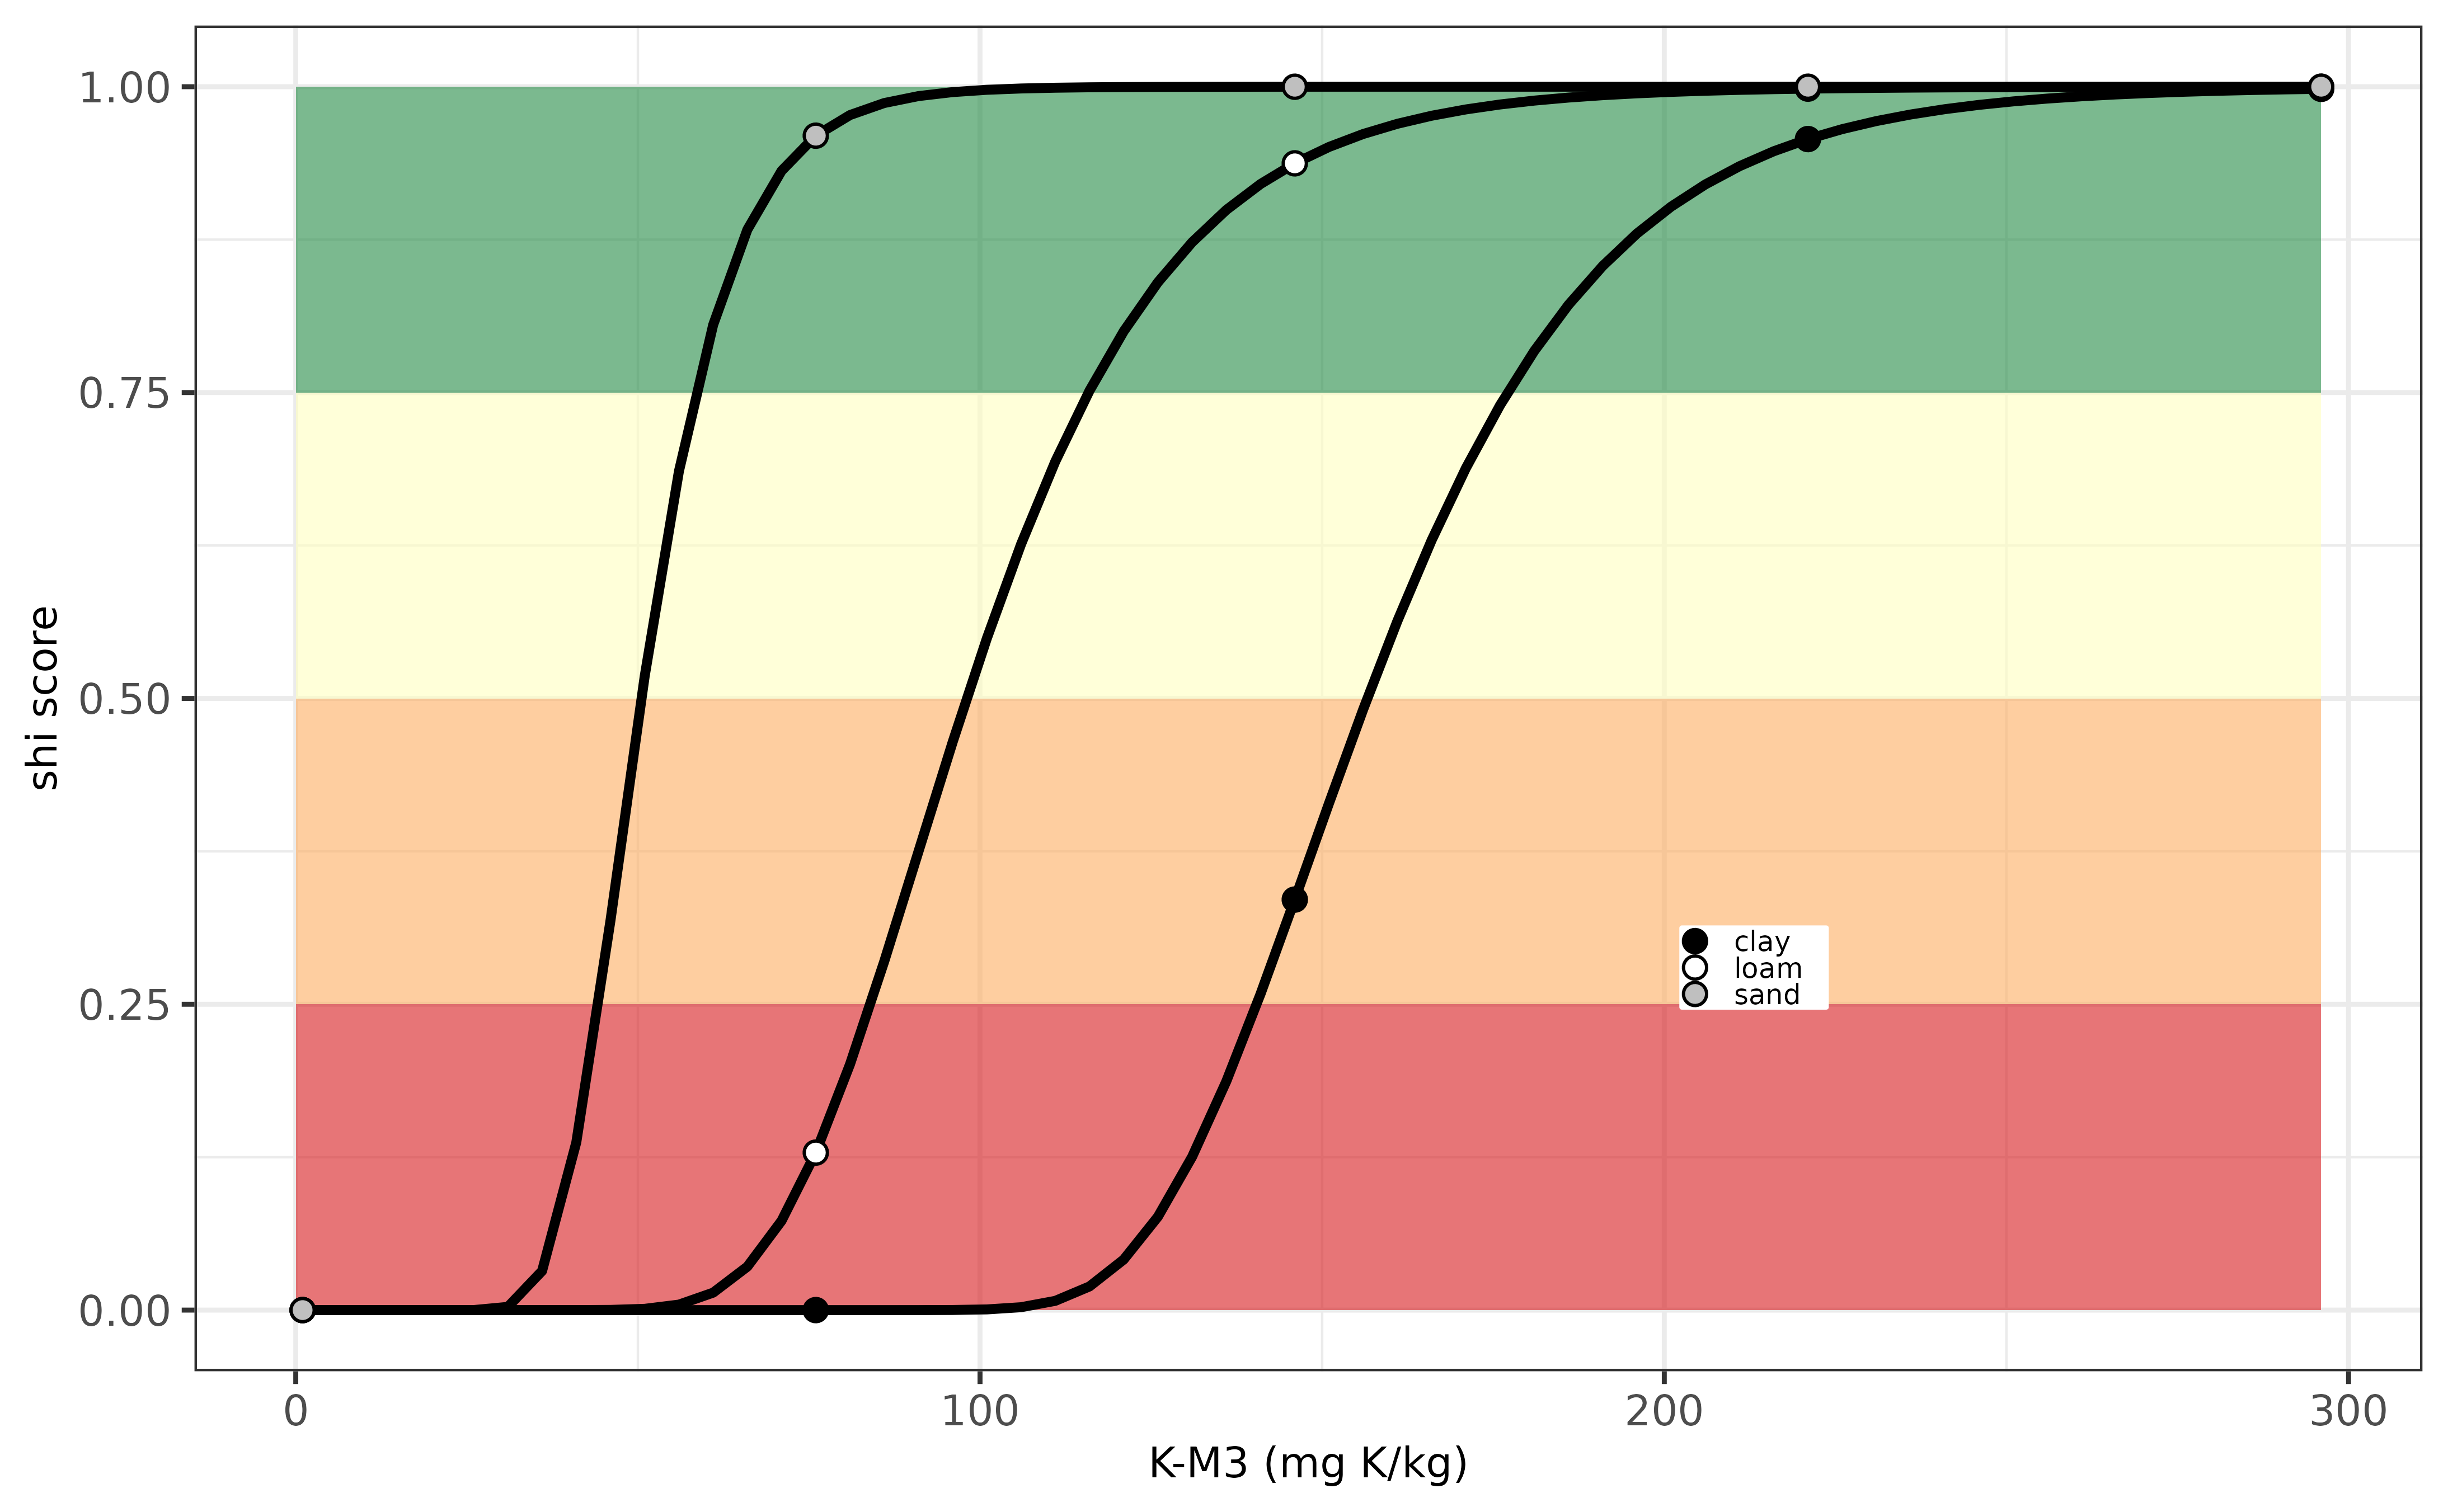
Below an example is visualized how the soil health index varies in relation to variation in K-M3. The optimum soil K threshold value for sustainable crop production is around 300 mg K/ kg for the clay soil and is around 175 to 225 mg K/kg for the loam and sandy soil. The soil index rapidly decreases when K-M3 values decreases. Potassium deficiencies occur when K-M3 goes down to 100 mg Kkg for the sandy soil and down to 200 mg K/kg for the clay soil.
Evaluation K-indicator for Slovak Republic.
Slovenia (SL)
The potassium supply in view of soil health for agricultural soils in
Slovenia can be calculated using osi_c_potassium_sl using
the following inputs:
- B_LU, being the crop code, an unique number for each crop
- B_TEXTURE_HYPRES, being the soil texture class according to HYPRES classification system
- A_K_AL, being the extracted K content with Ammonium Lactate extraction, unit mg K/kg.
The K supplying capacity differs in soils with varying textures.
Based on the soil mineralogy (clay, sand and silt content) one can
easily classify the USDA texture class using
osi_get_TEXTURE_HYPRES.The K supplying capacity does not
differ among crop types; there is a single optimum threshold defined.
Information on the threshold values for K-AL in view of sustainable crop
production has been derived from Fotyma et al. (2008) who wrote a
comprehensive overview of soil testing methods in Eastern Europe
entitled “Soil testing methods and fertilizer recommendations in
Central–Eastern European countries”.
Note that the crop codes for Slovenia are not yet available in
osi_crops package table.
Below an example is visualized how the soil health index varies in relation to variation in K-AL. The optimum soil K threshold value for sustainable crop production is around 200 mg K/ kg for the three soil types evaluated (clay, sand and loam). Potassium deficiency occurs at K-AL values around 100 mg K/kg.
Evaluation K-indicator for Slovenia.
United Kingdom (UK)
The potassium supply in view of soil health for agricultural soils in
United Kingdom can be calculated using osi_c_potassium_uk
using the following inputs:
- B_LU, being the crop code, an unique number for each crop
- A_K_AN, being the extracted K content with ammonium nitrate, unit mg K /kg
- A_SOM_LOI, being the organic matter content, unit in percentage (%), being used to convert the A_K_AN to the K-index classification system used in the UK.
The K supplying capacity differs among soil textures, but in the UK the evaluation of the K supply is similar for all soil types but it varies for grassland and crop land. Information on the threshold values for K-AN in view of sustainable crop production can be found on the website of AHDB. A more detailed table can be found here
Note that the crop codes for the UK are not yet available in
osi_crops package table. For now, the B_LU code is used to
differentiate between vegetables and non-vegetables.
Below an example is visualized how the soil health index varies in relation to variation in K-AN. The optimum soil K threshold value for sustainable crop production is around 125 mg K/ kg for grassland and potato. Differences among crops are small. Potassium deficiency occurs when the K-AN value decreases below around 60 mg K/kg.
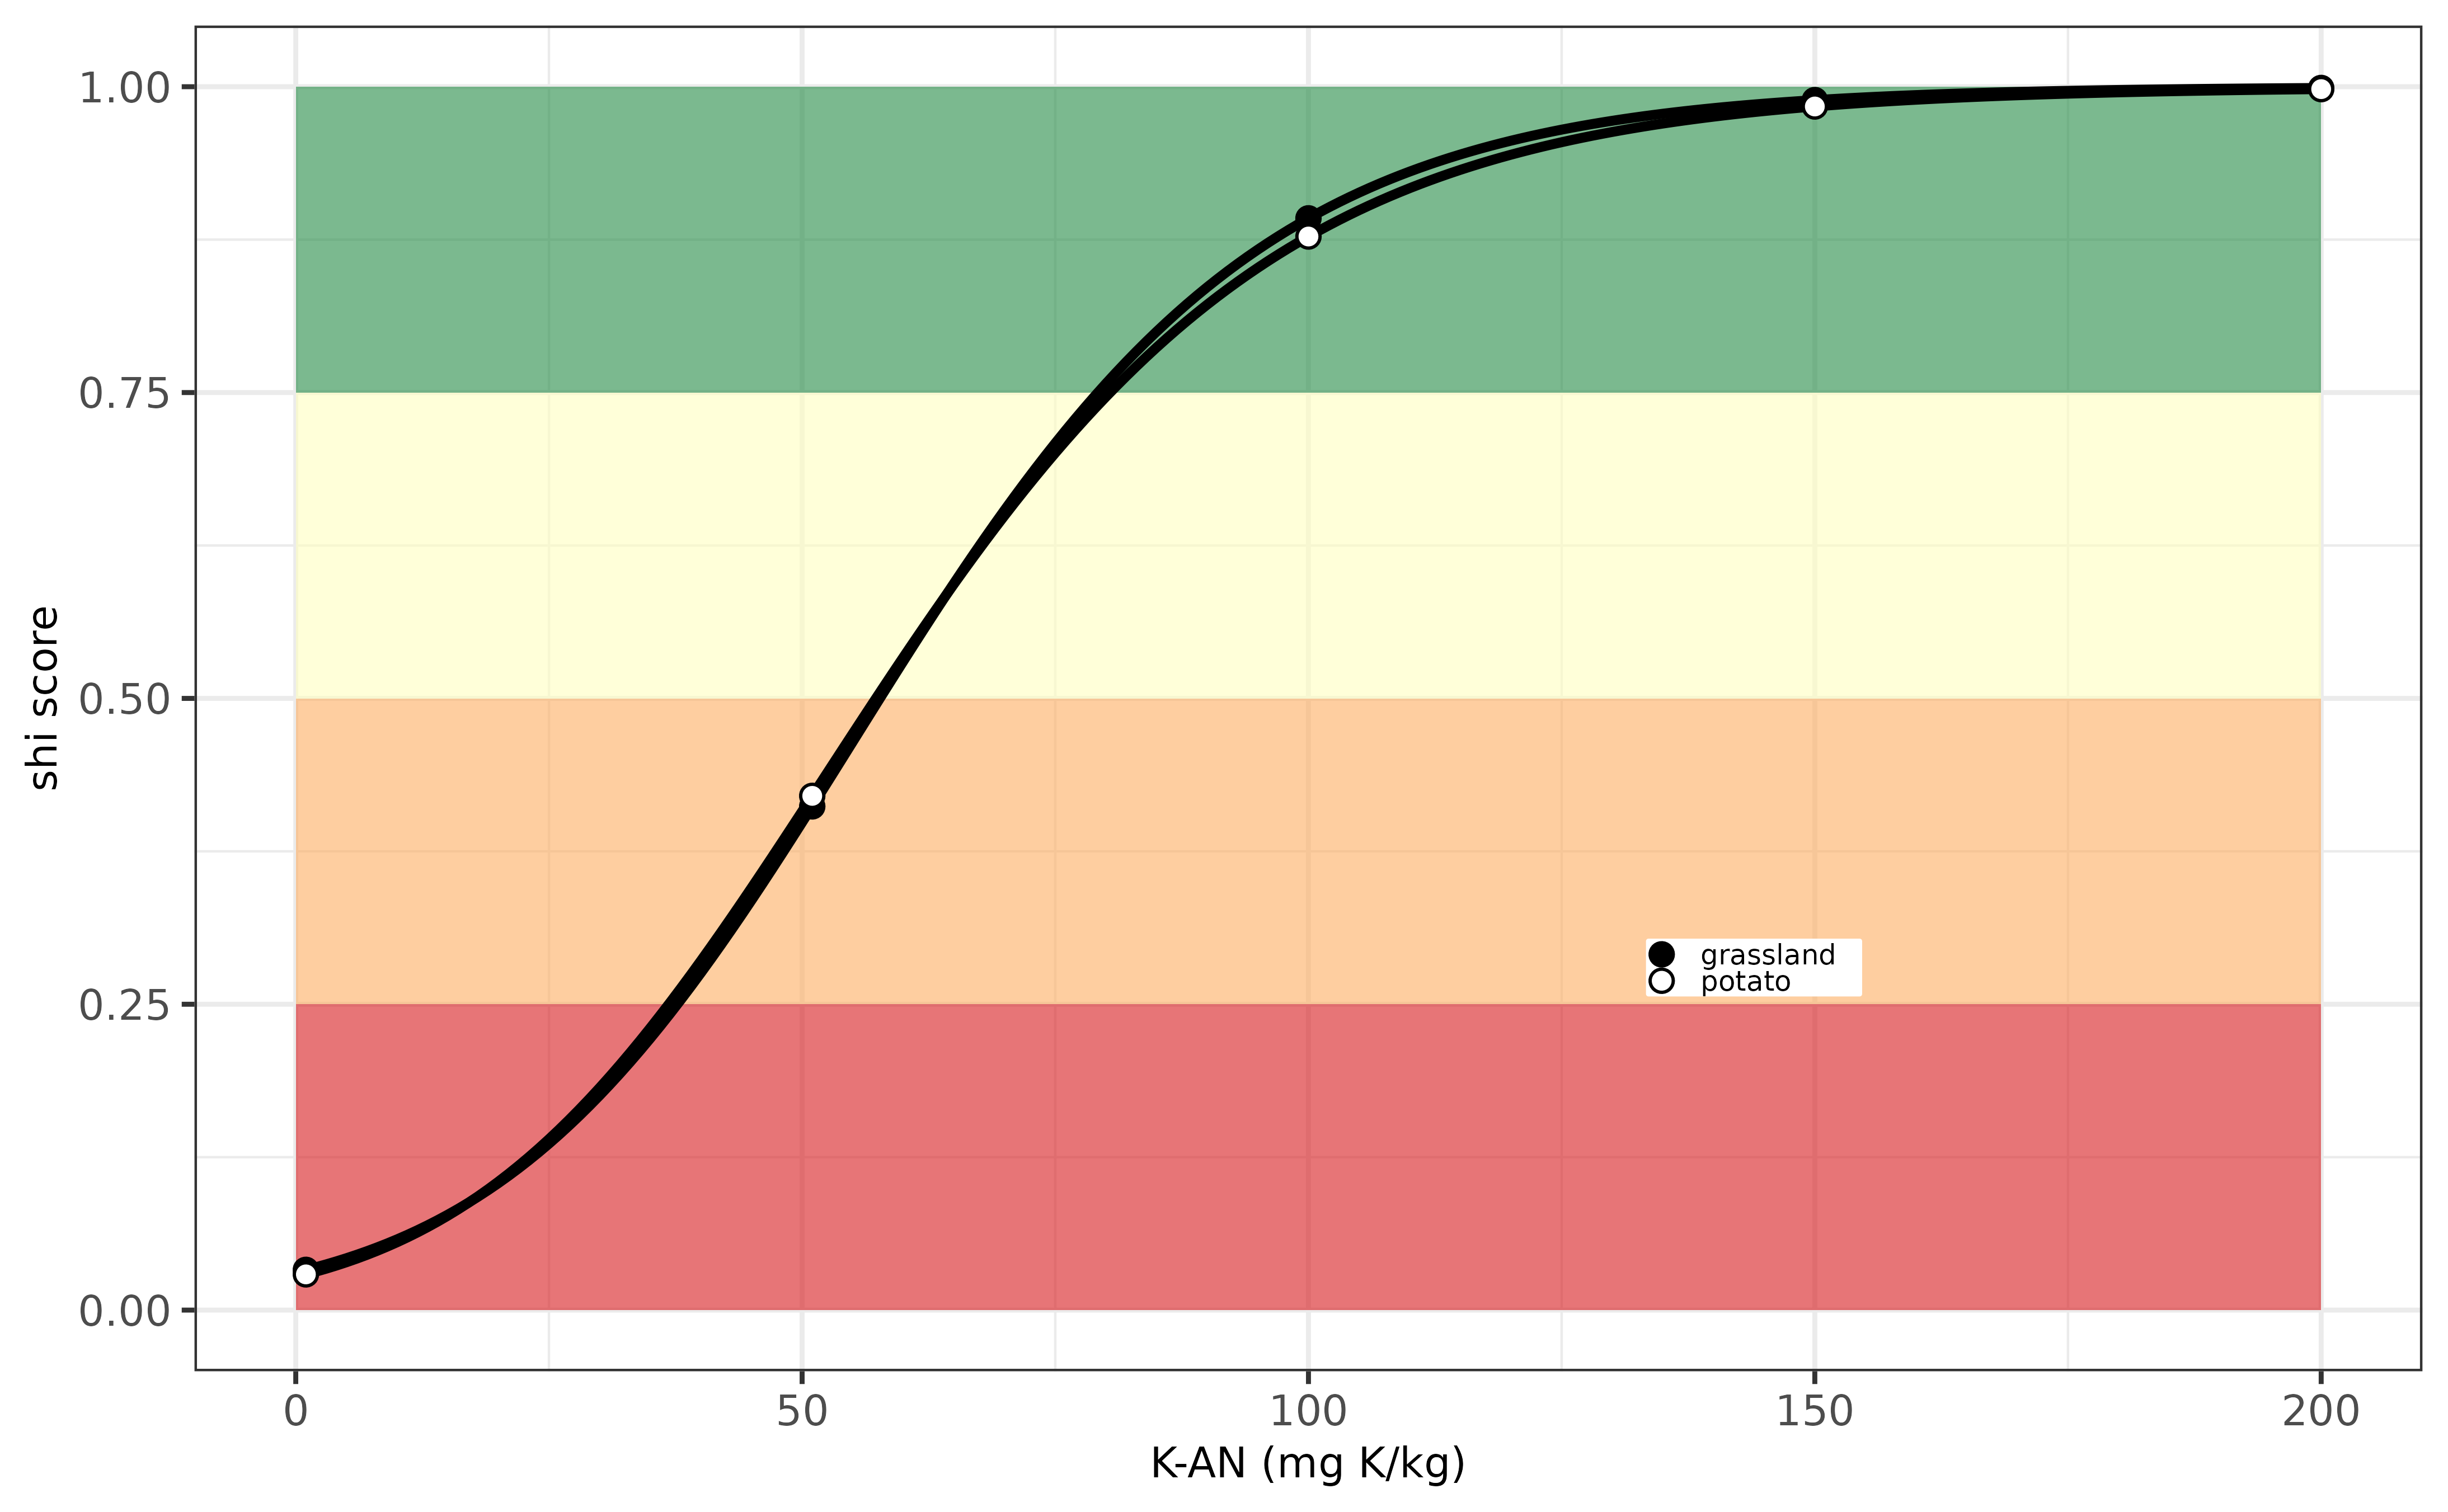
Evaluation K-indicator for the UK.
Reading more?
More vignettes will be made available regarding the derivation of all
soil health indicators, the aggregation methods applied, the derivation
of optimum land use given the current soil quality assessments, and the
best management practices to be applied to improve the soil quality. See
for example the vignettes vignette("eu_osi_for_magnesium")
and the general introduction in
vignette("eu_osi_introduction"). Are you interested to
contribute, please contact the author(s) of this R package. Enjoy!