EU OSI for phosphor
Gerard Ros & Elise van Eynde
2025-12-12
eu_osi_for_phosphor.RmdIntroduction
Phosphorus (P) is an essential nutrient for crops and is applied to agricultural soil to bring or keep the soil at a certain target soil P status in view of an optimal crop yield. As such the P supply is a key aspect of soil health. Phosphorus in soil can be present as organic and inorganic P, with inorganic P typically contributing between 35 and 70% to total soil P. For soils receiving long-term inputs of P fertilizers and animal manures, the contribution of inorganic P to total soil P usually increases, as inorganic P is abundant in animal manures. Inorganic P includes phosphate sorbed to reactive soil particles (such as amorphous Fe- and Al-(hydr)oxides and oxidic clay mineral edges) and phosphate-bearing minerals. In the normal pH range of 5 to 8 of most agricultural soils, P sorption is the major mechanism controlling the P concentration in soil solution. The extent to which soils can sorb P depends on the maximum P sorption capacity which for non-calcareous soils relates to the amorphous Fe- and Al-(hydr)oxides contents.
Assessments of the soil health in view of phosphorus usually follow the agronomic Build-Up and Maintenance approach, where measured soil P contents are used to classify the soil P status, which is used to derive the best P fertilizer strategy for a specific crop. With this approach, all agricultural soils ultimately reach a “target” soil P status being optimal for crop produciton. Currently, this target soil P status is determined by the economic optimization of crop yield at which the P fertilizer inputs equals crop P removal, although some countries recommend adding additional P to correct for “inevitable” P losses caused by a progressive shift of plant-available P to less available soil P forms and environmental P losses. The target soil P status currently corresponds to the P status at which over 90% of relative crop yield is achieved. This target soil P status is derived from long-term P fertilization experiments.
Routine agronomic soil P tests have in common that they make use of extraction methods to determine a certain fraction of total soil P that is correlated to crop response. The extracted amount of P varies with the nature of the extraction solution and methodological factors such as soil pretreatment, the soil-to-solution ratio and the analytical technique used for P measurement. For measuring readily available P forms that can be taken up by the crop in the short-term, soil P tests (referred to as P intensity methods) such as the 0.01 M CaCl2 and the water extraction method can be used. For the measurement of labile or moderately strong bound P (referred to as P quantity methods), extractions with acid ammonium acetate-lactate (P-AL), Mehlich3 and sodium bicarbonate (P-Olsen) can be used.
The European Open Soil Index assesses the soil function for P supply using the agronomic knowledge base as being used in the various EU countries. The soil P supply is transformed into an unitless indicator score ranging between zero (poor quality) and one (optimum quality). This indicator score reflects the ‘distance to target’ (i.e. difference between the current and optimum situation, while ensuring that other soil functions are not limiting). The further it deviates from score 1, the poorer the soil function works. An indicator value of 0.5 approximately corresponds to the lower threshold level of the fertilization guidelines under which (additional) fertilization is recommended (given the ‘buildup and maintenance’ approach as being implemented in fertilizer recommendation systems). Overall, the indicator value can be interpreted as good (>0.75), sufficient (0.5-0.75), and poor (<0.5).
The soil P wrapper function
In euso package has a wrapper function to assess the soil health
index for the soil P supply in agricultural soils across Europe. The
wrapper function is osi_c_phosphor and has the following
inputs:
- B_LU (character) The crop code
- B_SOILTYPE_AGR (character) The soil type in a particular region
- A_CLAY_MI (numeric) The clay content of the soil (%)
- A_SAND_MI (numeric) The sand content of the soil (%)
- A_SOM_LOI (numeric) The organic matter content of the soil (%)
- A_C_OF (numeric) The organic carbon content in the soil (g C / kg)
- A_PH_WA (numeric) The pH measured in water.
- A_PH_CC (numeric) The pH measured in CaCl2 extraction.
- A_CACO3_IF (numeric) the percentage of CaCO3 (%)
- A_P_AAA (numeric) The exchangeable P-content of the soil measured via acid ammonium acetate extraction (mg P / kg)
- A_P_AL (numeric) The P-content of the soil extracted with ammonium lactate (mg P / kg)
- A_P_CAL (numeric) The exchangeable P-content of the soil measured via Calcium Ammonium Lactate (mg P/ kg)
- A_P_CC (numeric) The P-content of the soil extracted with CaCl2 (mg P / kg)
- A_P_DL (numeric) The P-content of the soil extracted with double lactate (mg P / kg)
- A_P_M3 (numeric) The exchangeable P-content of the soil measured via Mehlich 3 extracton (mg P/ kg)
- A_P_OL (numeric) The P-content of the soil extracted with Olsen (mg P / kg)
- A_P_WA (numeric) The P-content of the soil extracted with water (mg P / kg)
- B_COUNTRY (character) The country code
Not all the inputs are mandatory. The function runs with the soil
parameters being available for LUCAS. Other soil P extraction methods
can be added, but when unknown, then these are estimated from P-Olsen
using published pedotransferfunctions, using the function
osi_conv_phosphor. Similarly, helper functions are applied
to estimate A_C_OF, A_PH_KCL and
A_PH_WA.
Note that the IACS crop codes codes have been added to the
osi_crops package table from version 0.4.0 onwards. The
crop codes are only present for the countries AT, BE, BG, CZ, DE, DK,
ES, FI, FR, IT, NL, PT, SE, and SK.
The wrapper function wraps country specific P assessment functions. These are illustrated and described in this vignette per country, sorted alphabetically.
Austria (AT)
The phosphorus supply in view of soil health can be calculated using
osi_c_phosphor_at using the following inputs:
- B_LU, being the crop code, an unique number for each crop
- A_P_CAL, being the extracted P content with calcium ammonium lactate, unit mg P /kg.
The soil P threshold for optimum soil health is generic for all soil types but differs between arable land and grassland. The optimum threshold is set around 47-68 mg P/kg for grassland and around 47-111 mg P/kg for cropland. More information can be found in the article of Bohner et al. (2013), that can be downloaded here with a reference to the publication entitled RICHTLINIEN FÜR DIE SACHGERECHTE DÜNGUNG, 2006: Anleitung zur Interpretation von Bodenuntersuchungsergebnissen in der Landwirtschaft. 6. Aufl. Bundesministerium für Land- und Forstwirtschaft, Umwelt und Wasserwirtschaft, 80 S that can be found here.
Note that the IACS crop codes codes have been added to the
osi_crops package table in version 0.4.0.
Three examples are given, one for potato (3301090400), one for maize (3301030000) and one for grassland (3301090205). The optimum soil P threshold is around 60 mg P/kg and actually not different between both land uses. P deficiency symptoms start to occur when the P-CAL becomes lower than 30 mg P/kg.
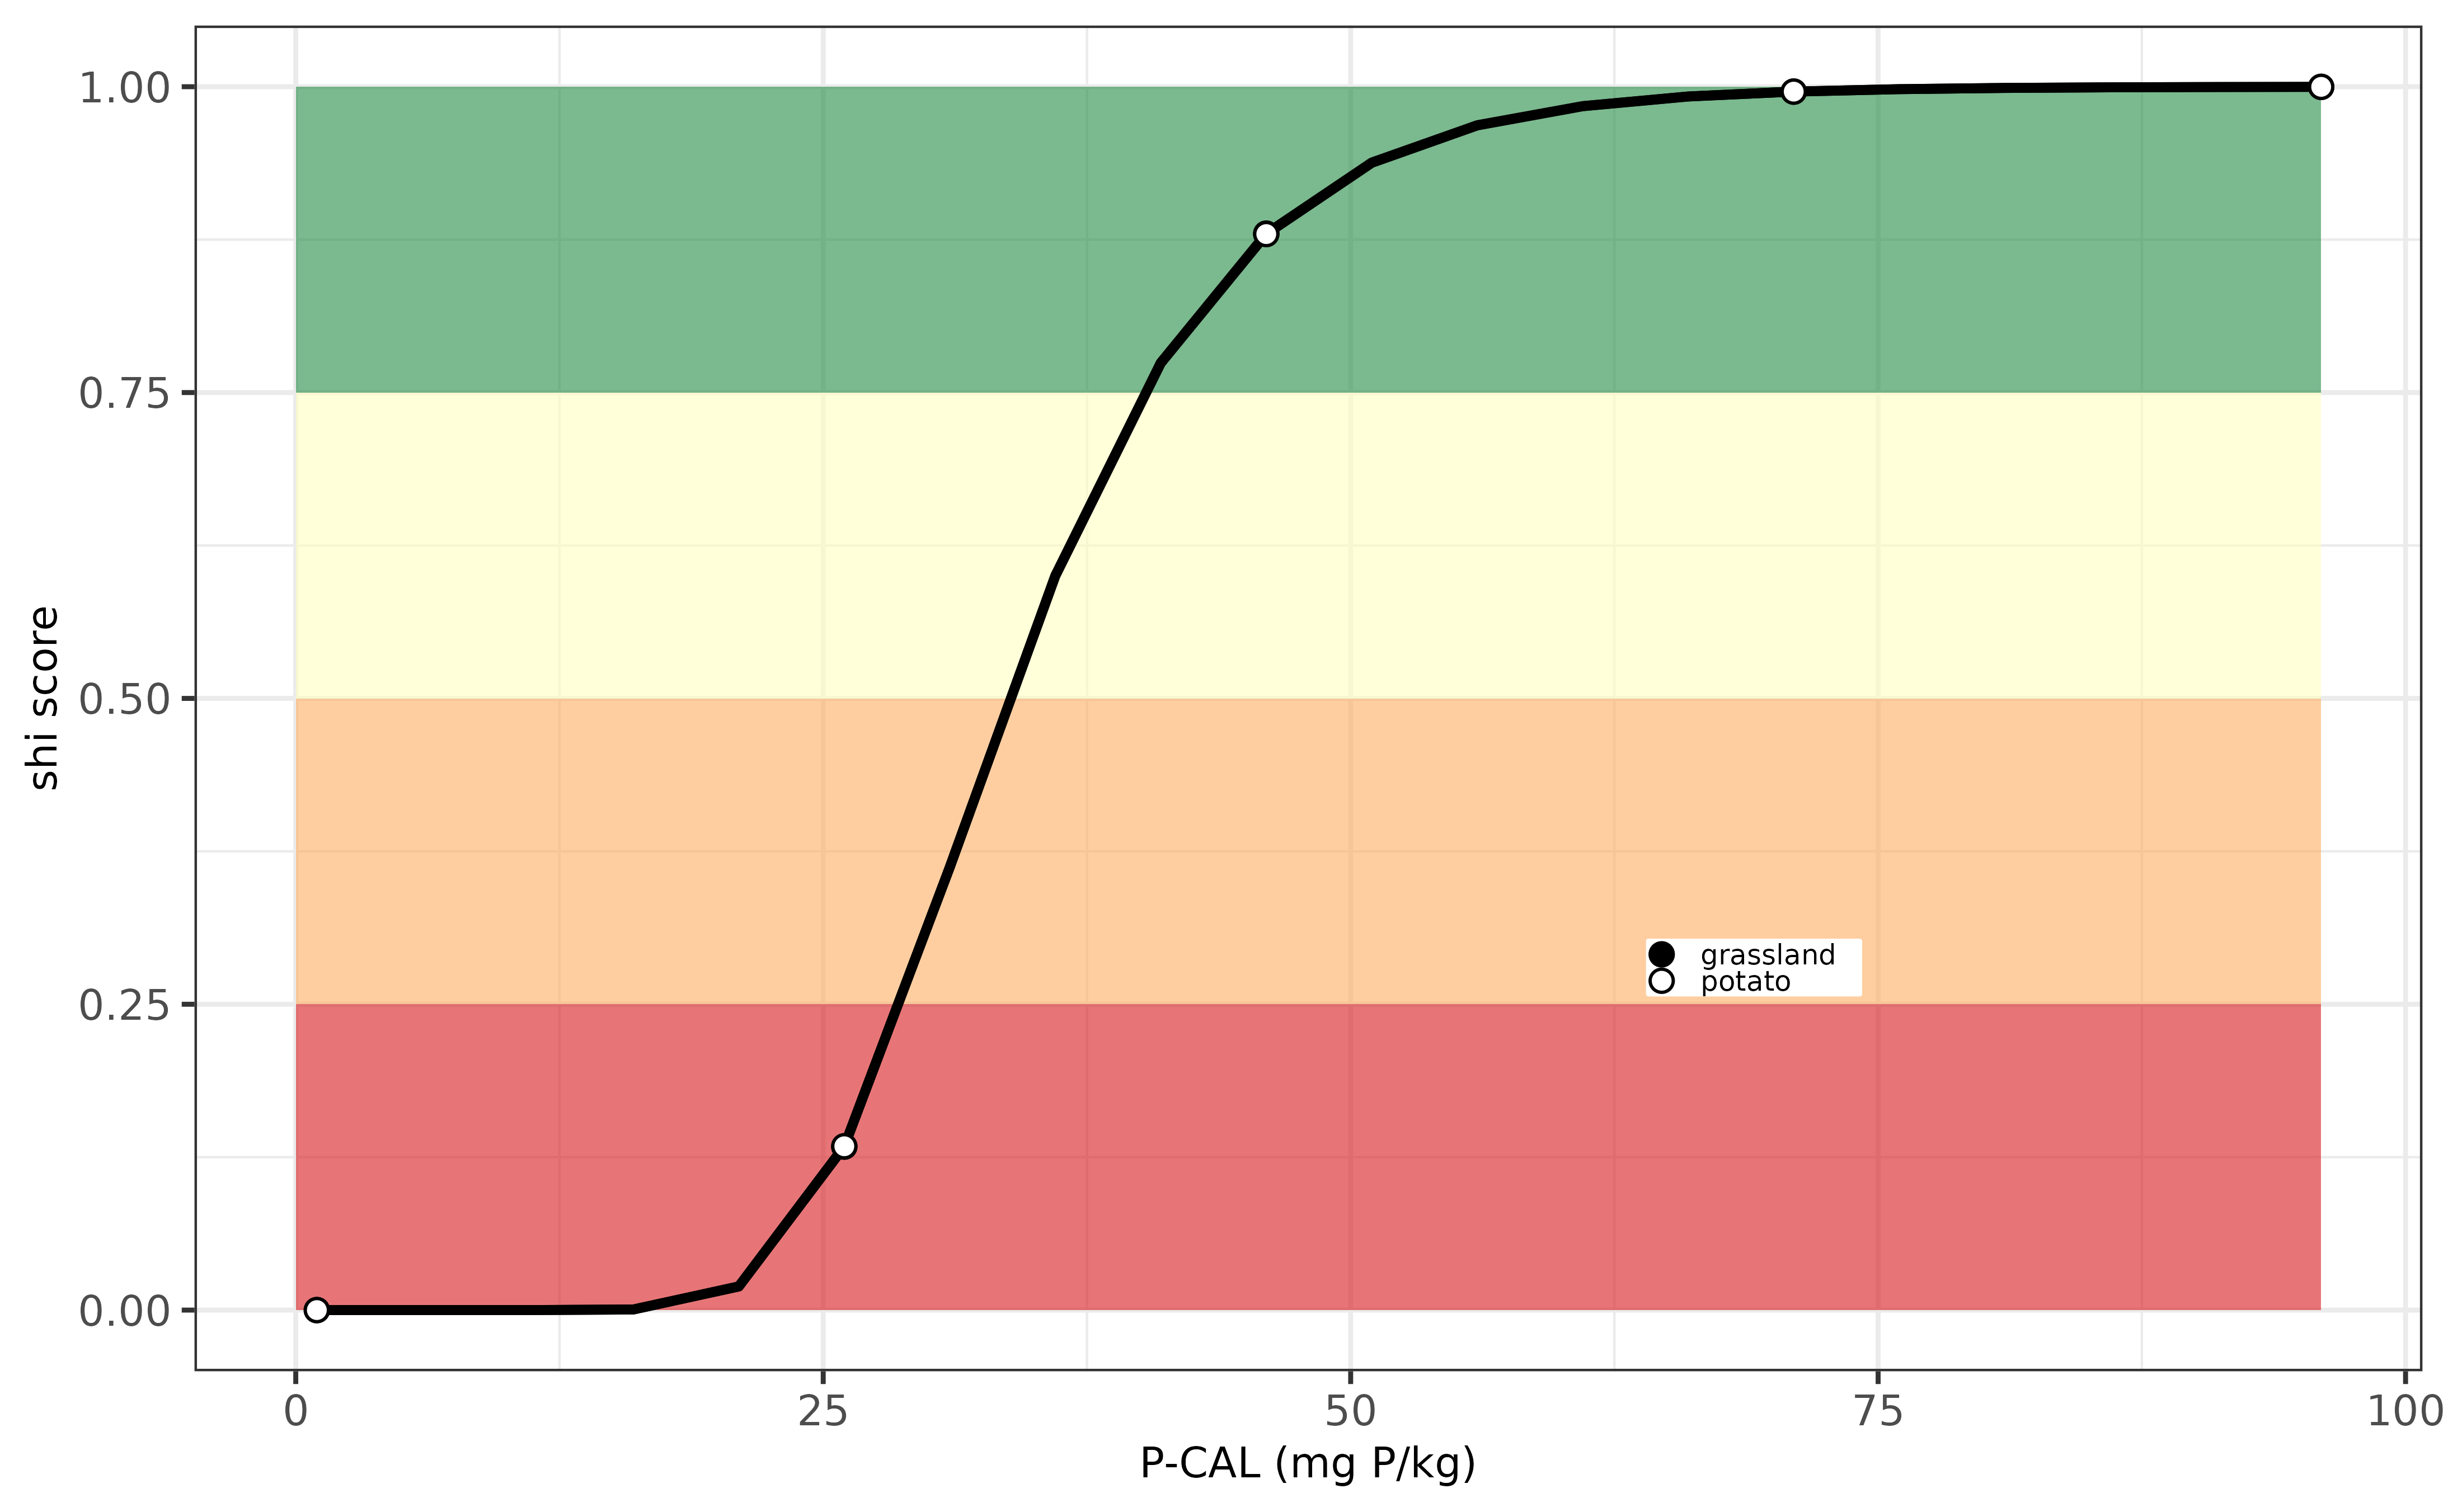
Evaluation P-indicator for Austria.
Belgium (Flanders)
The phosphorus supply in Belgium is based on the P level in soil being extracted with ammonium lactate. There is also a distinction between cropland or grassland with a higher optimum threshold value for grassland than cropland. More information of the optimum threshold values and the soil P status evaluation can be found here.
In the euosi package the soil health score for P supply can be
calculated with osi_c_phosphor_be, requiring the following
inputs:
- B_LU, being the Belgium crop code, an unique number for each crop
- A_P_AL, being the extracted P content with ammonium lactate, unit mg P /kg (internally converted to the unit mg P/100g as being used in the Belgium context).
An example is illustrated below for a sugar beet crop (crop code 91) and a grassland (code = 60) for a single soil with P-content of 25 mg P / 100g:
# show an example for sugar beet crop (code = 91) and grassland (code = 60)
c(osi_c_phosphor_be(B_LU = '91', A_P_AL = 250),
  osi_c_phosphor_be(B_LU = '60', A_P_AL = 250))
## [1] 0.9999987 0.9871195Below the same example but then visualised for a series of soils with a P-AL value ranging from 0 to 300 mg P per kg (equal to 0 to 30 mg P/100g) for two crops: grassland and sugar beet. From this example one can see that the soil health index score varies from very low to very high, depending on the content of P-AL (mg P/kg).
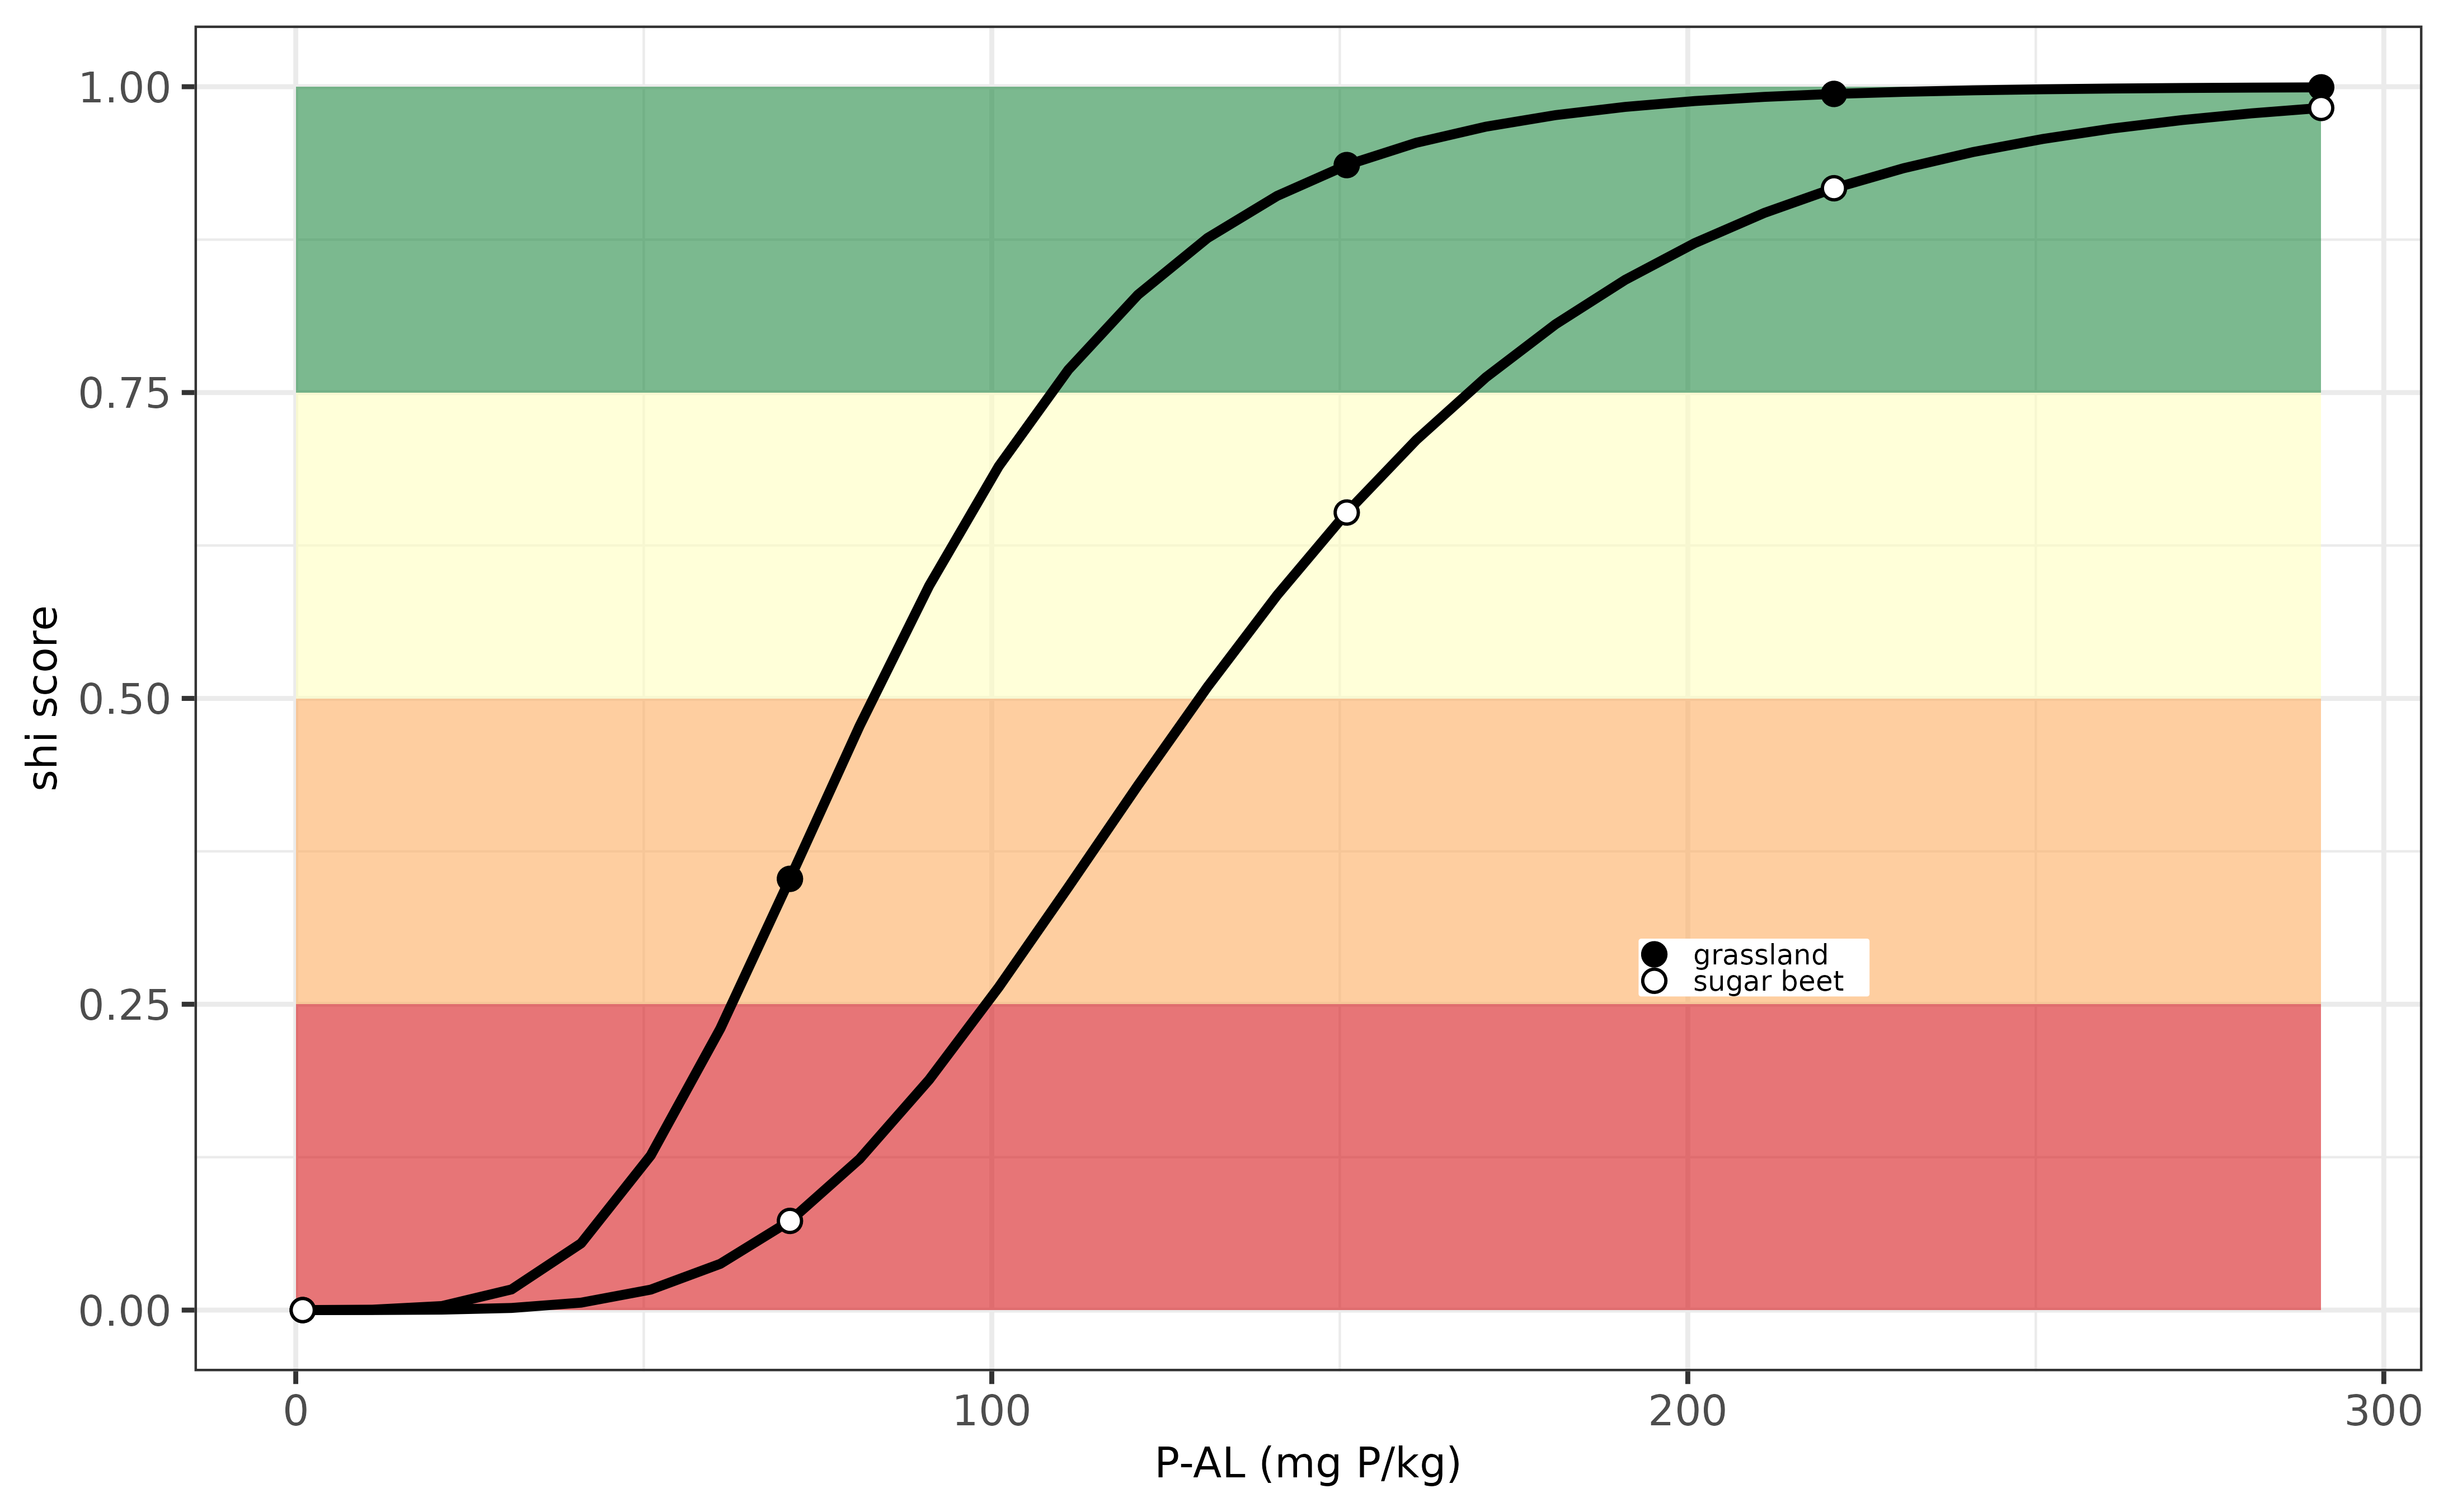
Evaluation P-indicator for the Belgium.
Switzerland (CH)
The phosphorus supply in view of soil health for agricultural soils
in Switzerland can be calculated using osi_c_phosphor_ch
using the following inputs:
- B_LU, being the crop code, an unique number for each crop
- A_P_AAA, being the extracted P content with ammonium acetate, unit mg P /kg.
More information can be found in Flisch et al. (2017) entitled
Grundlagen für die Düngung landwirtschaftlicher Kulturen in der Schweiz.
This document can be downloaded here
Note that the crop codes are not yet available in osi_crops
package table.
Below an example is visualized how the soil health index varies in relation to variation in P-AAA. The optimum soil P threshold value for sustainable crop production is around 75 mg P/ kg, and the soil index decreases to zero when P-AAA values decreases down to 20 mg P/kg.
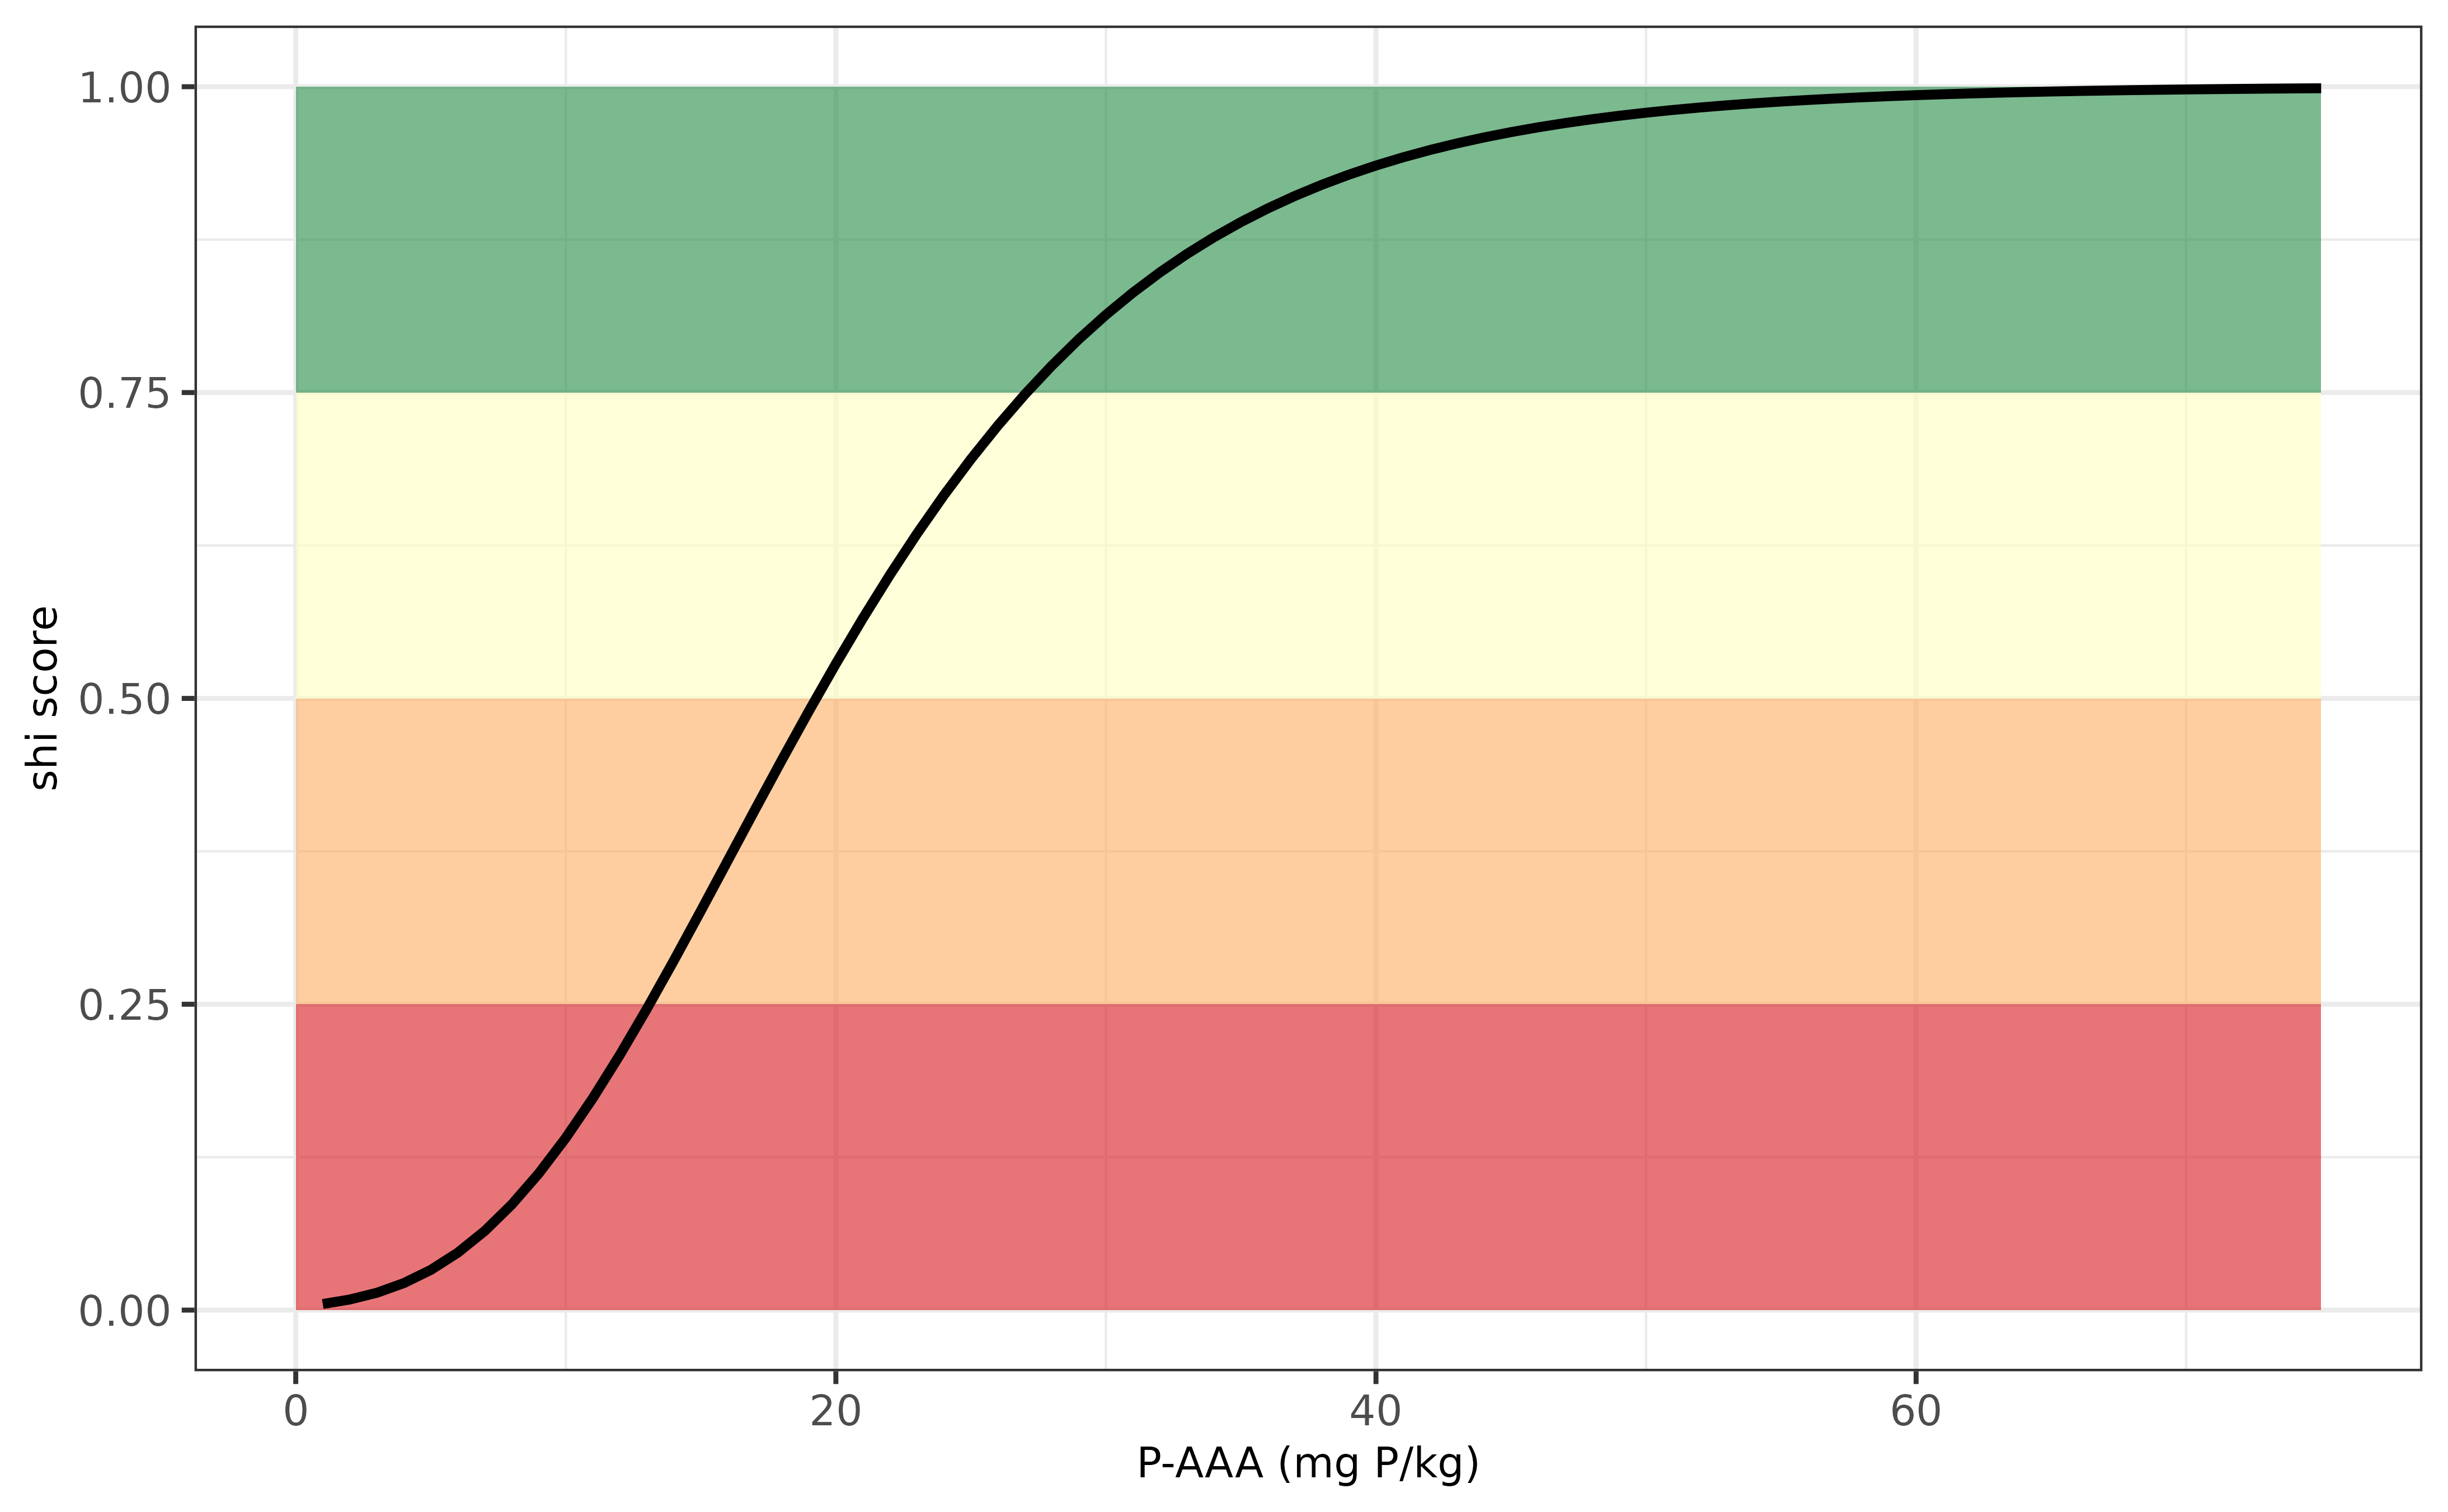
Evaluation P-indicator for Switzerland.
Czech Republic (CZ)
The phosphorus supply in view of soil health for agricultural soils
in Czech Republic can be calculated using osi_c_phosphor_cz
using the following inputs:
- B_LU, being the crop code, an unique number for each crop
- A_P_M3, being the extracted P content with Mehlich-III, unit mg P /kg.
Information on the threshold values for P-Mehlich in view of sustainable crop production has been derived from Fotyma et al. (2008) who wrote a comprehensive overview of soil testing methods in Eastern Europe entitled “Soil testing methods and fertilizer recommendations in Central–Eastern European countries”.
Note that the IACS crop codes codes have been added to the
osi_crops package table in version 0.4.0.
Below an example is visualized how the soil health index varies in relation to variation in P Mehlich-III. The optimum soil P threshold value for sustainable crop production is around 125 mg P/ kg, and the soil index rapidly decreases to zero when P Mehlich-III values decreases down to 50 mg P/kg.

Evaluation P-indicator for Czech Republic.
Germany (DE)
The phosphorus supply in view of soil health for agricultural soils
in Germany can be calculated using osi_c_phosphor_de using
the following inputs:
- B_LU, being the crop code, an unique number for each crop
- A_SOM_LOI, being the soil organic matter content, in units percentage (%)
- A_CLAY_MI, being the clay content, in units percentage (%)
- A_P_CAL, being the extracted P content with calcium ammonium lactate, unit mg P /kg (internally converted to the common unit mg P /100g for mineral soils and mg P/100 ml for peat soils, as being used in German fertilizer recommendation systems).
- A_P_DL, being the extracted P content with double lactate, unit mg P/kg, optional.
The P supplying capacity differ for soils varying in clay content and distinghuises also between peaty and mineral soils. Information on the threshold values for P-CAL in view of sustainable crop production has been derived by the VDLUFA. In 2020 the threshold values have been updated. For more information, see here
Note that the IACS crop codes for Germany are available in
osi_crops package table.
Below an example is visualized how the soil health index varies in relation to variation in P-AL. The optimum soil P threshold value for sustainable crop production is around 60 mg P/ kg for peat soils and around 100 mg P/kg for mineral soils. The soil index decreases when P-AL values decreases down to 20 mg P/kg (peat soils) or 50 mg P/kg (mineral soils).
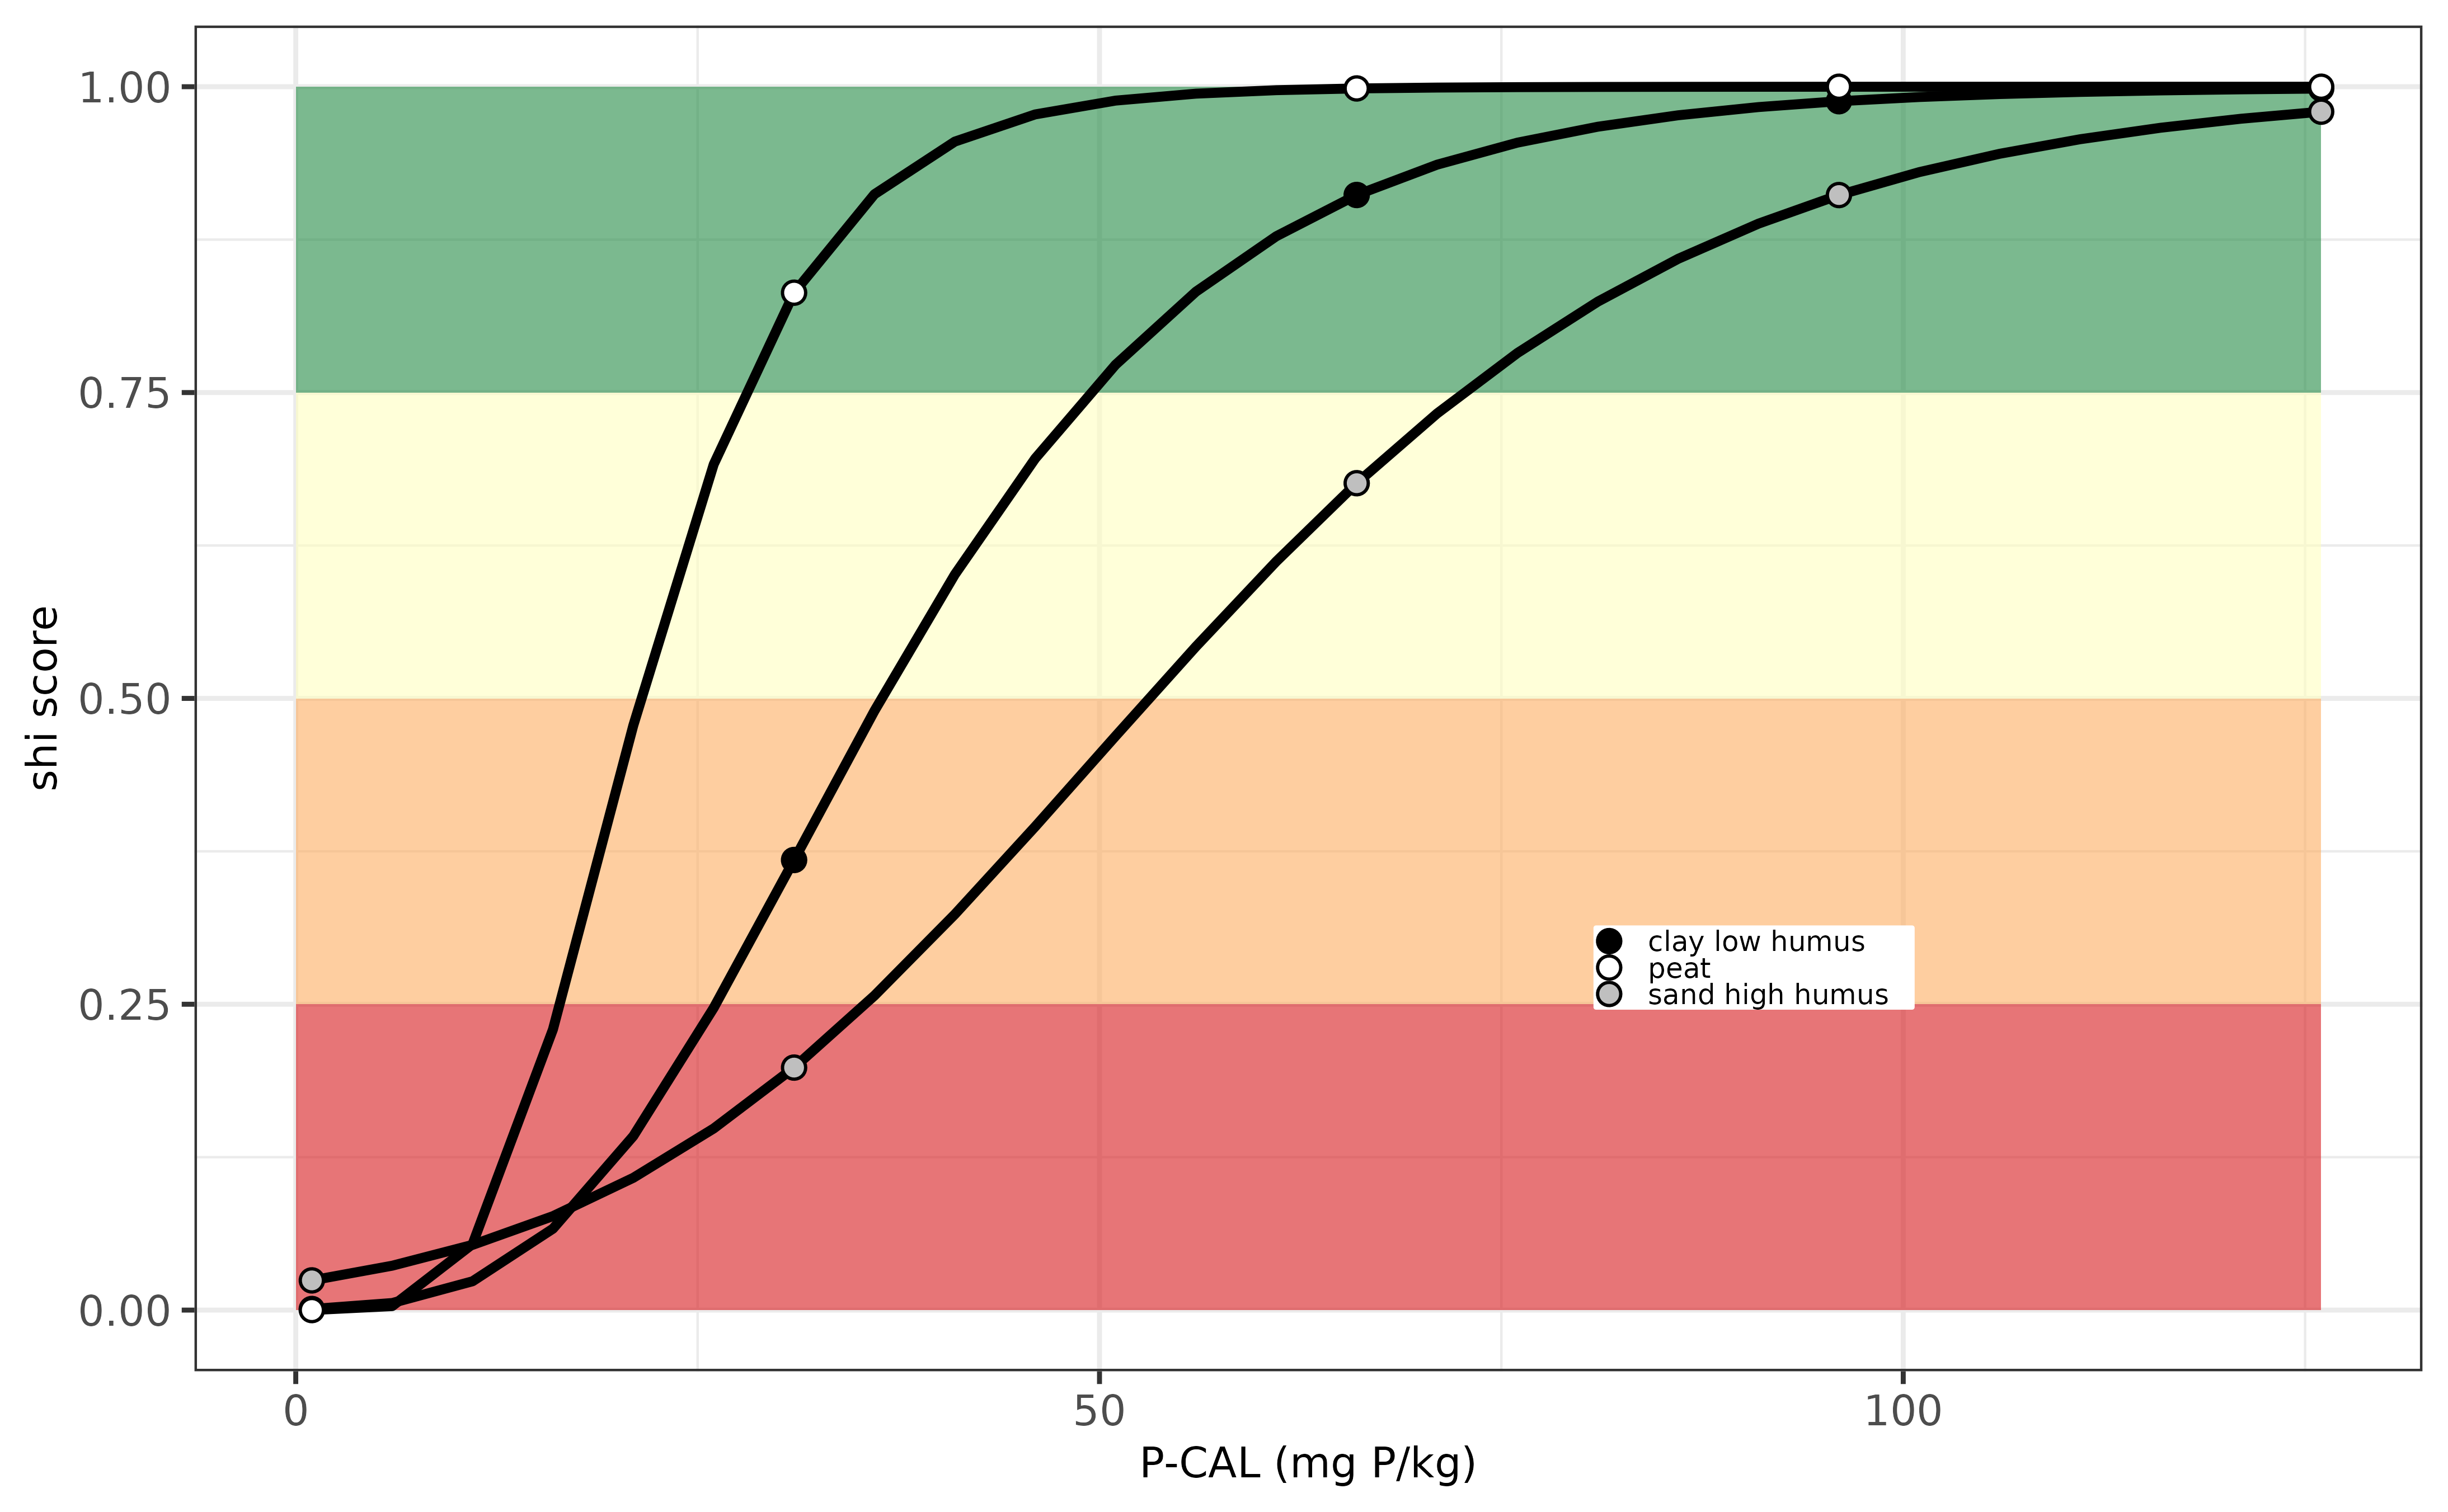
Evaluation P-indicator for Germany.
Denmark (DK)
The phosphorus supply in Denmark is based on the P level in soil being extracted with the Olsen method. There is no distinction between cropland or grassland or between soil types. The threshold values for optimum soil P levels are taken from the study of Knudsen & Schnug (2016), with the table found here
In the euosi package the soil health score for P supply can be
calculated with osi_c_phosphor_dk, requiring the following
inputs:
- B_LU, being the crop code, an unique number for each crop
- A_P_OL, being the extracted P content with Olsen, unit mg P /kg.
Note that the IACS crop codes for Denmark are available in
osi_crops package table.
Below the same example but then visualised for a series of soils with a P-Olsen value ranging from 0 to 70 mg P per kg. The optimum soil P threshold value for sustainable crop production is around 50 mg P/ kg for all soils. The soil index decreases when P-Olsen values decreases down to 30 mg P/kg.
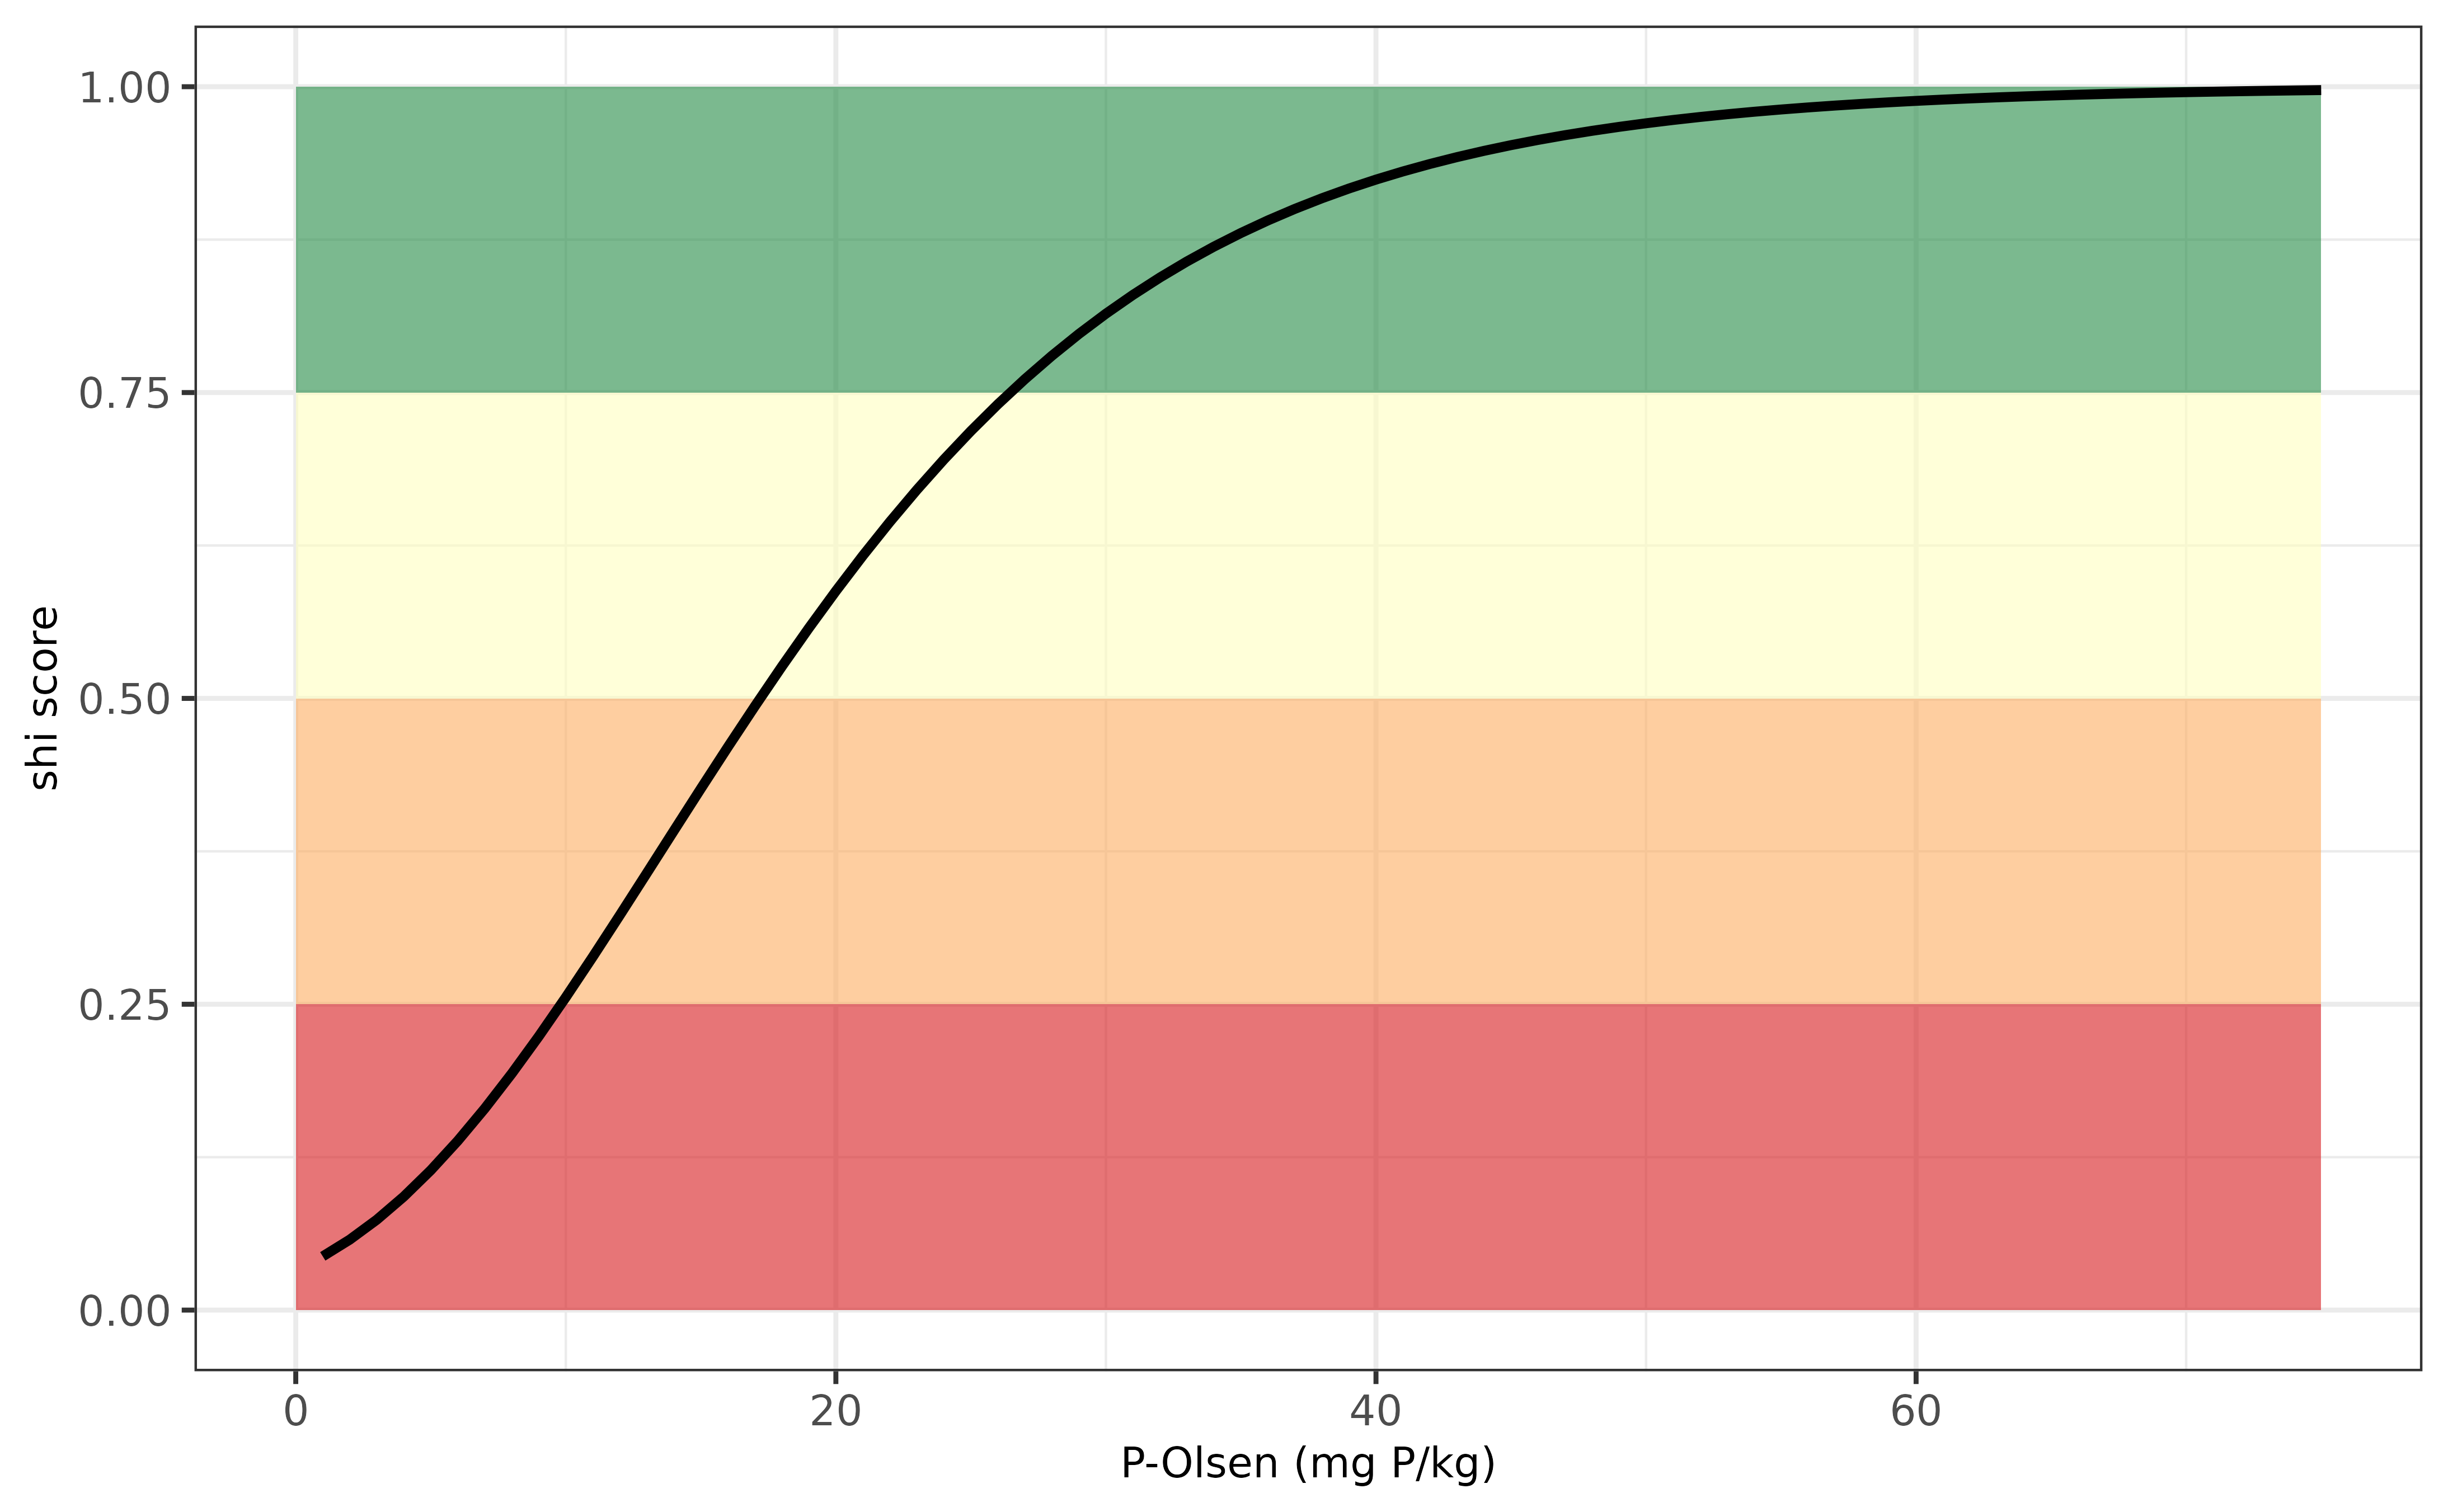
Evaluation P-indicator for the Denmark.
Estonia (EE)
The phosphorus supply in view of soil health for agricultural soils
in Estonia can be calculated using osi_c_phosphor_ee using
the following inputs:
- B_LU, being the crop code, an unique number for each crop
- A_SOM_LOI, being the soil organic matter content, in units percentage (%)
- A_P_M3, being the extracted P content with Mehlich-III, unit mg P /kg.
The P supplying capacity differs in soils with high humus content (>2%) and for soils with low humus content (<2%). Information on the threshold values for P-Mehlich in view of sustainable crop production has been derived from Fotyma et al. (2008) who wrote a comprehensive overview of soil testing methods in Eastern Europe entitled “Soil testing methods and fertilizer recommendations in Central–Eastern European countries”.
Note that the IACS crop codes for Estonia are not yet available in
osi_crops package table.
Below an example is visualized how the soil health index varies in relation to variation in P Mehlich-III. The optimum soil P threshold value for sustainable crop production is around 75 mg P/ kg for both soil types (low and high in soil organic matter), and the soil index rapidly decreases when P Mehlich-III values decreases down to 5 (humus rich soils) or 25 (humus poor soils) mg P/kg.
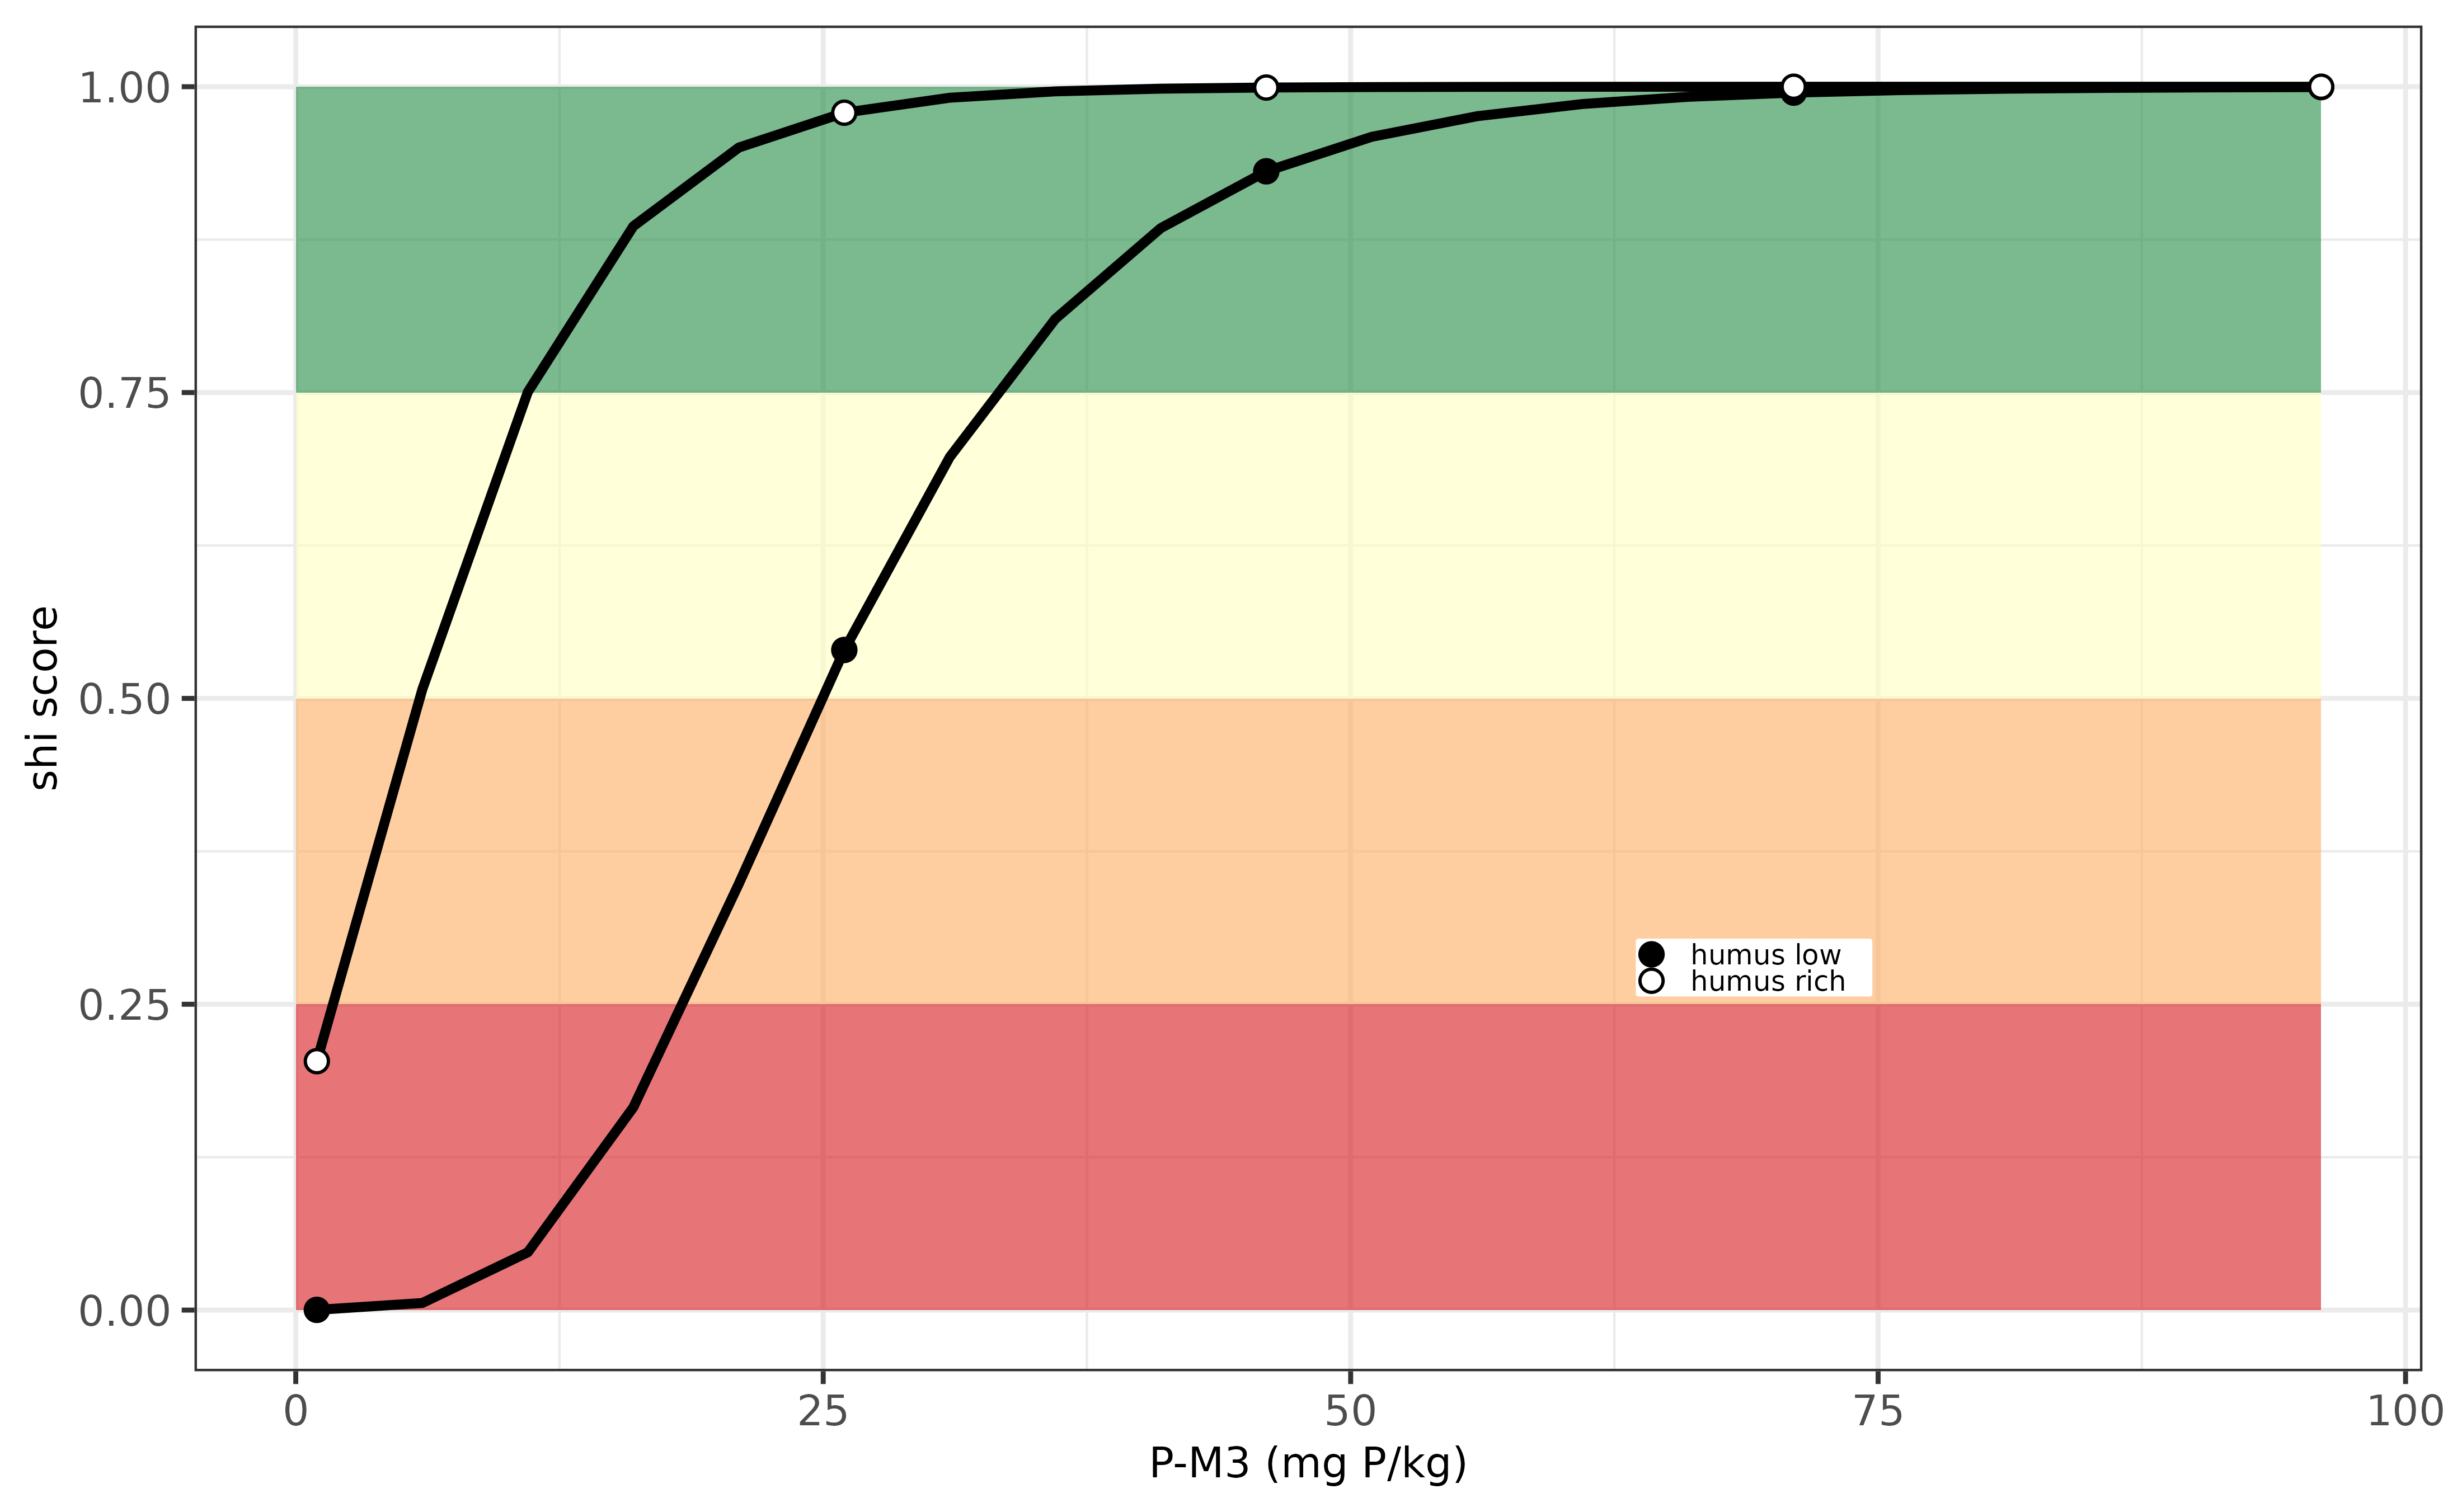
Evaluation P-indicator for Estonia.
Greece (EL)
The phosphorus supply in view of soil health for agricultural soils
in Greece can be calculated using osi_c_phosphor_el using
the following inputs:
- B_LU, being the crop code, an unique number for each crop
- A_P_OL, being the extracted P content with the Olsen method, unit mg P /kg
The evaluation of the P supply is similar for all soil types and land uses. Fertilizer manuals have not been found yet, but asking ChatGPT hinted to the study of the university of Thessaly from 1990 who distinghuises low, medium and high soil P fertility classes. This study was published here.
Note that the crop codes for Greece are not yet available in
osi_crops package table.
Below an example is visualized how the soil health index varies in relation to variation in P-Olsen. The optimum soil P threshold value for sustainable crop production is around 15 mg P/ kg for both land uses. Phosphorus deficiency occurs when the P-OL value decreases below around 8 mg P/kg.
Evaluation P-indicator for Greece.
Spain (ES)
The phosphorus supply in view of soil health for agricultural soils
in Spain can be calculated using osi_c_phosphor_es using
the following inputs:
- B_LU, being the crop code, an unique number for each crop
- A_CLAY_MI, being the clay content, in units percentage (%)
- A_P_OL, being the extracted P content with the Olsen method, unit mg P /kg
The P supplying capacity differ for soils varying in clay content, distinghuising sandy (Arenoso), loamy (Franco) and clayey (Arcilloso) soils. Information on the threshold values for P-Olsen in view of sustainable crop production has been derived by the fertilizer guidelines handbook entitled “PRÁCTICA DE LA FERTILIZACIÓN RACIONAL DE LOS CULTIVOS EN ESPAÑA”. This book is online available here.
Note that IACS crop codes for Spain are available in
osi_crops package table.
Below an example is visualized how the soil health index varies in relation to variation in P-Olsen. The optimum soil P threshold value for sustainable crop production is around 40 mg P/ kg for the three soil types. The soil index decreases more stronger on the sandy soils, in particular when P-Olsen values decreases down to 18 mg P/kg. For the clay soil the P availability remains quite high down to 5 mg P/kg.
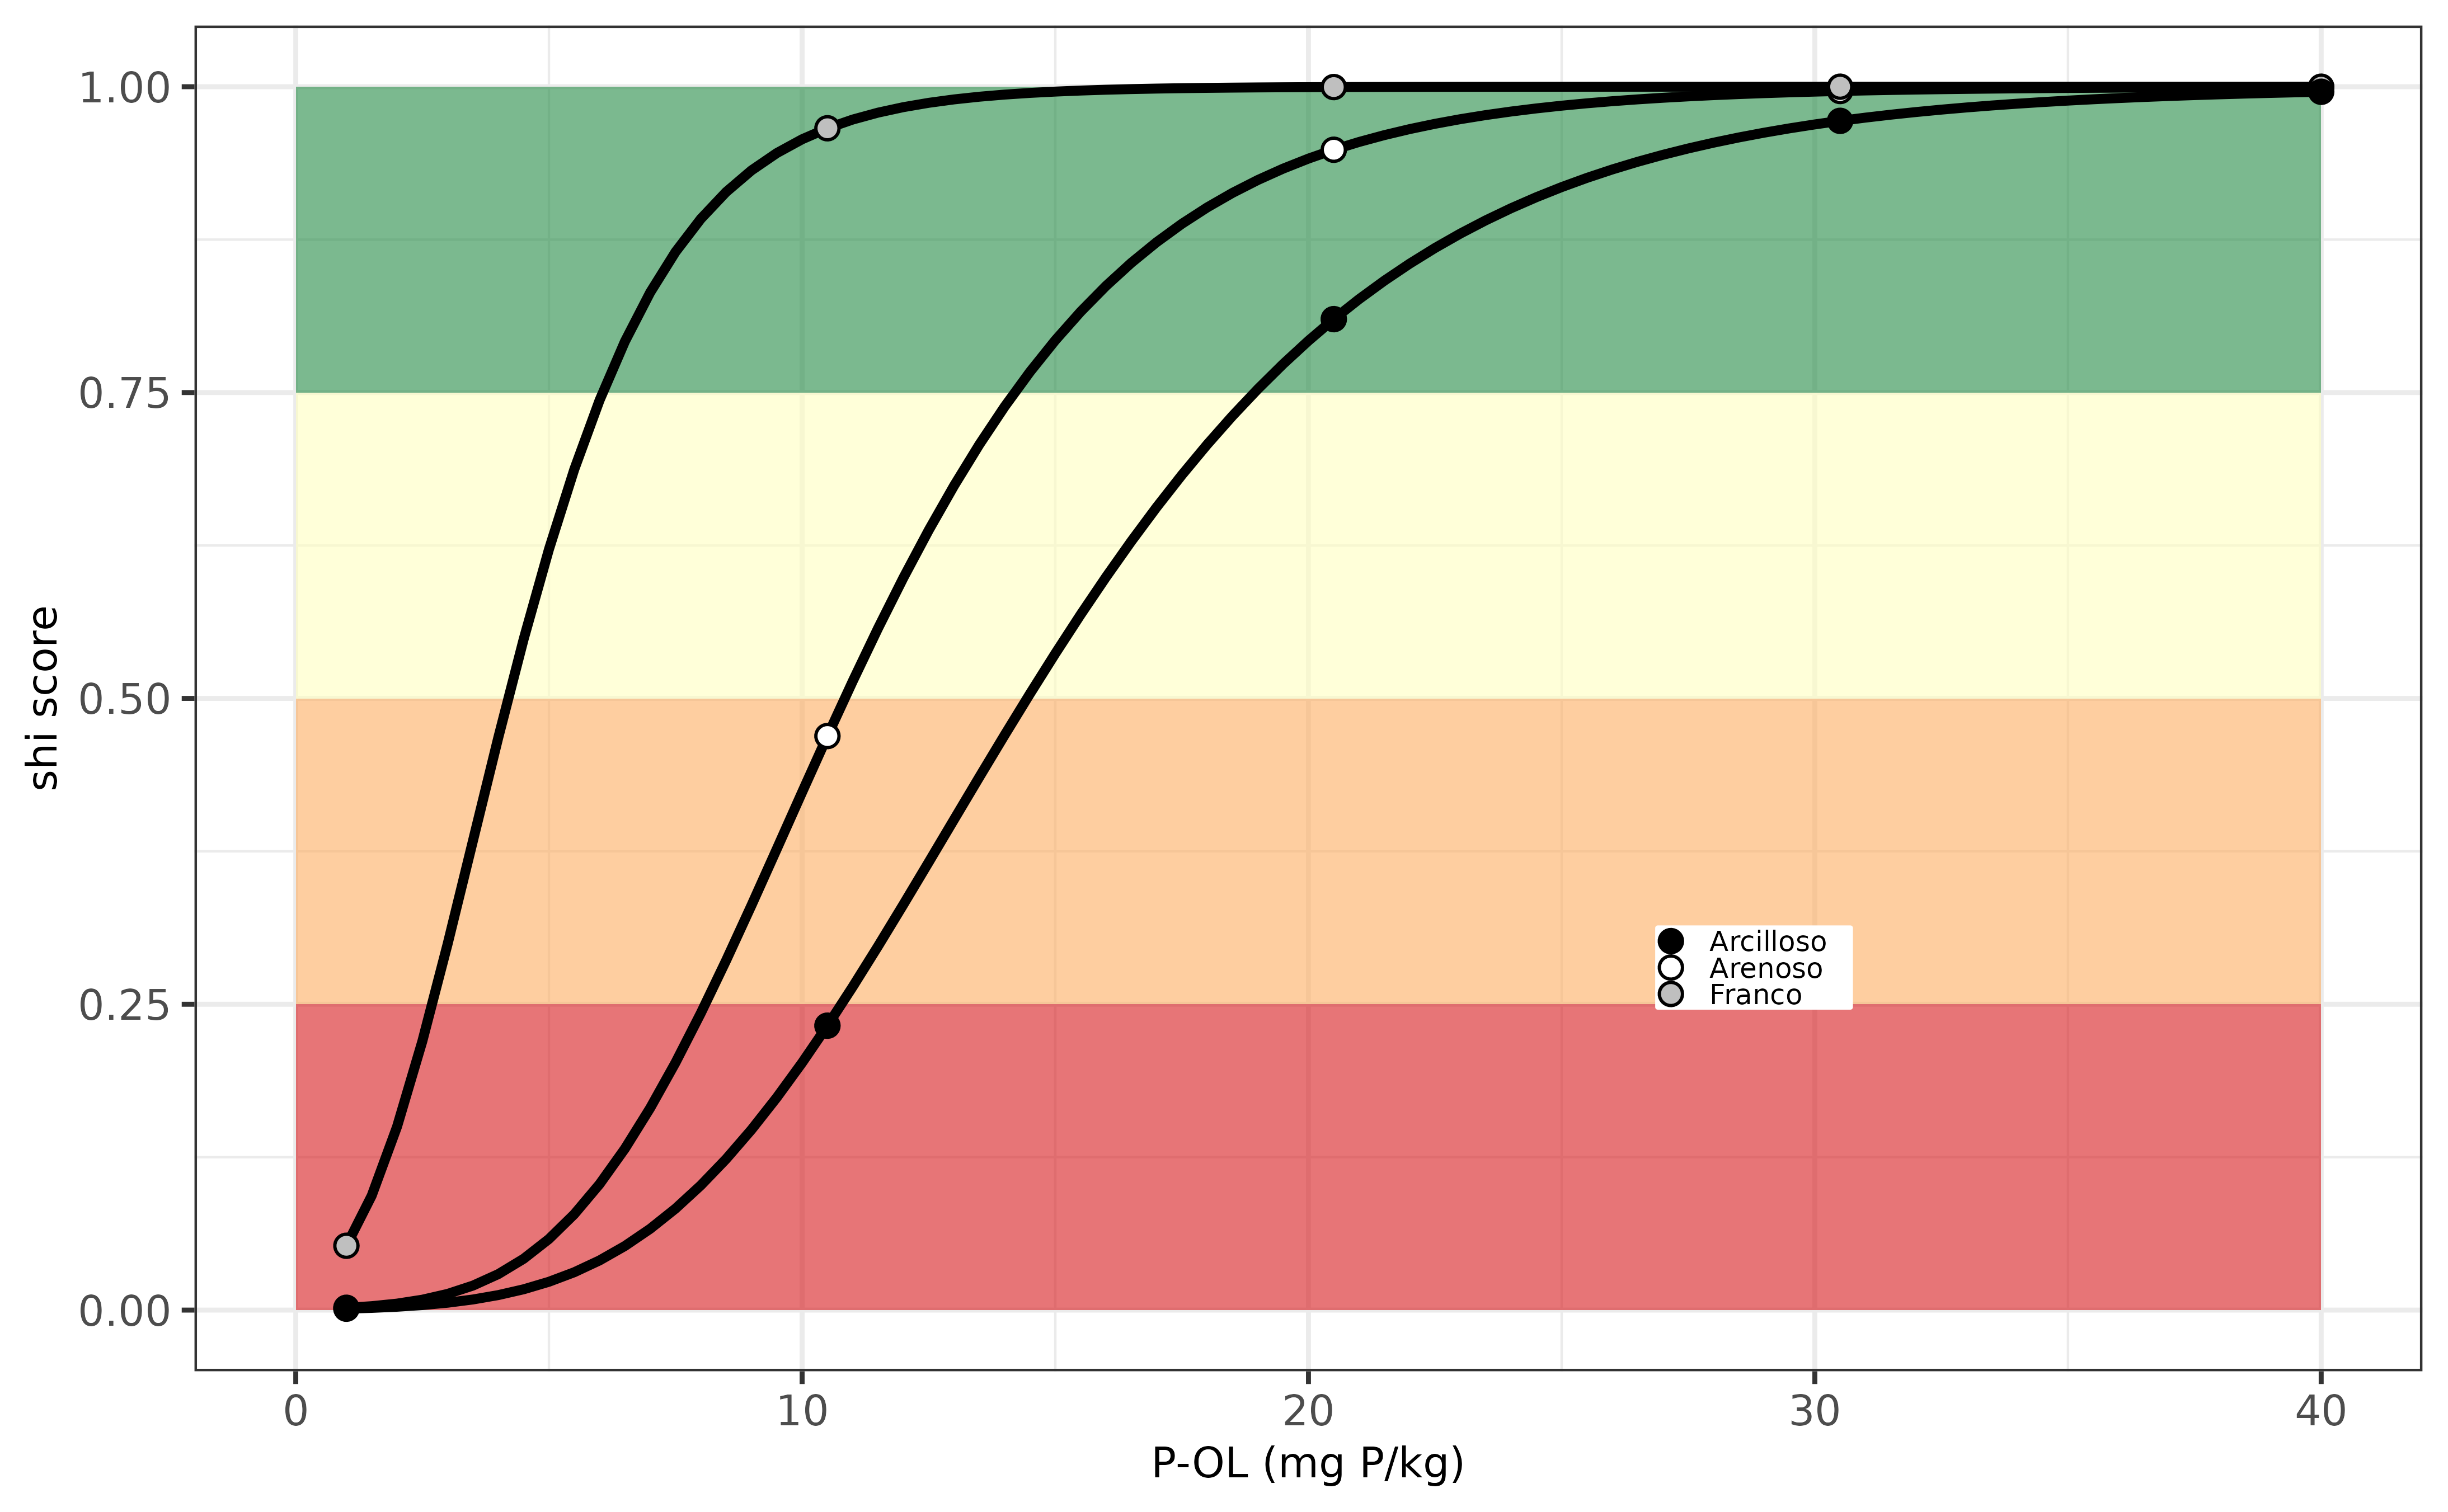
Evaluation P-indicator for Spain.
Finland (FI)
The phosphorus supply in view of soil health for agricultural soils
in Finland can be calculated using osi_c_phosphor_fi using
the following inputs:
- B_LU, being the crop code, an unique number for each crop
- B_TEXTURE_USDA, being the soil texture class according to USDA classification system
- A_P_AAA, being the extracted P content with ammonium acetate extraction, unit mg P /kg.
- A_C_OF, being the organic carbon content of the soil, in unit g C/kg, to distinghuish between mineral and peat soils.
The P supplying capacity differs in soils with varying textures.
Based on the soil mineralogy (clay, sand and silt content) one can
easily classify the USDA texture class using
osi_get_TEXTURE_USDA.
Note that the crop codes for Finland are available in
osi_crops package table.
Below an example is visualized how the soil health index varies in relation to variation in P-AAA for four soil types. The differences between the soil types is rather small. The optimum soil P threshold value for sustainable crop production is around 25 mg P/ kg for the four soil types evaluated (clay, sand,loam and peat), and the soil index decreases when P-AAA values decreases down to 5 mg P/kg.
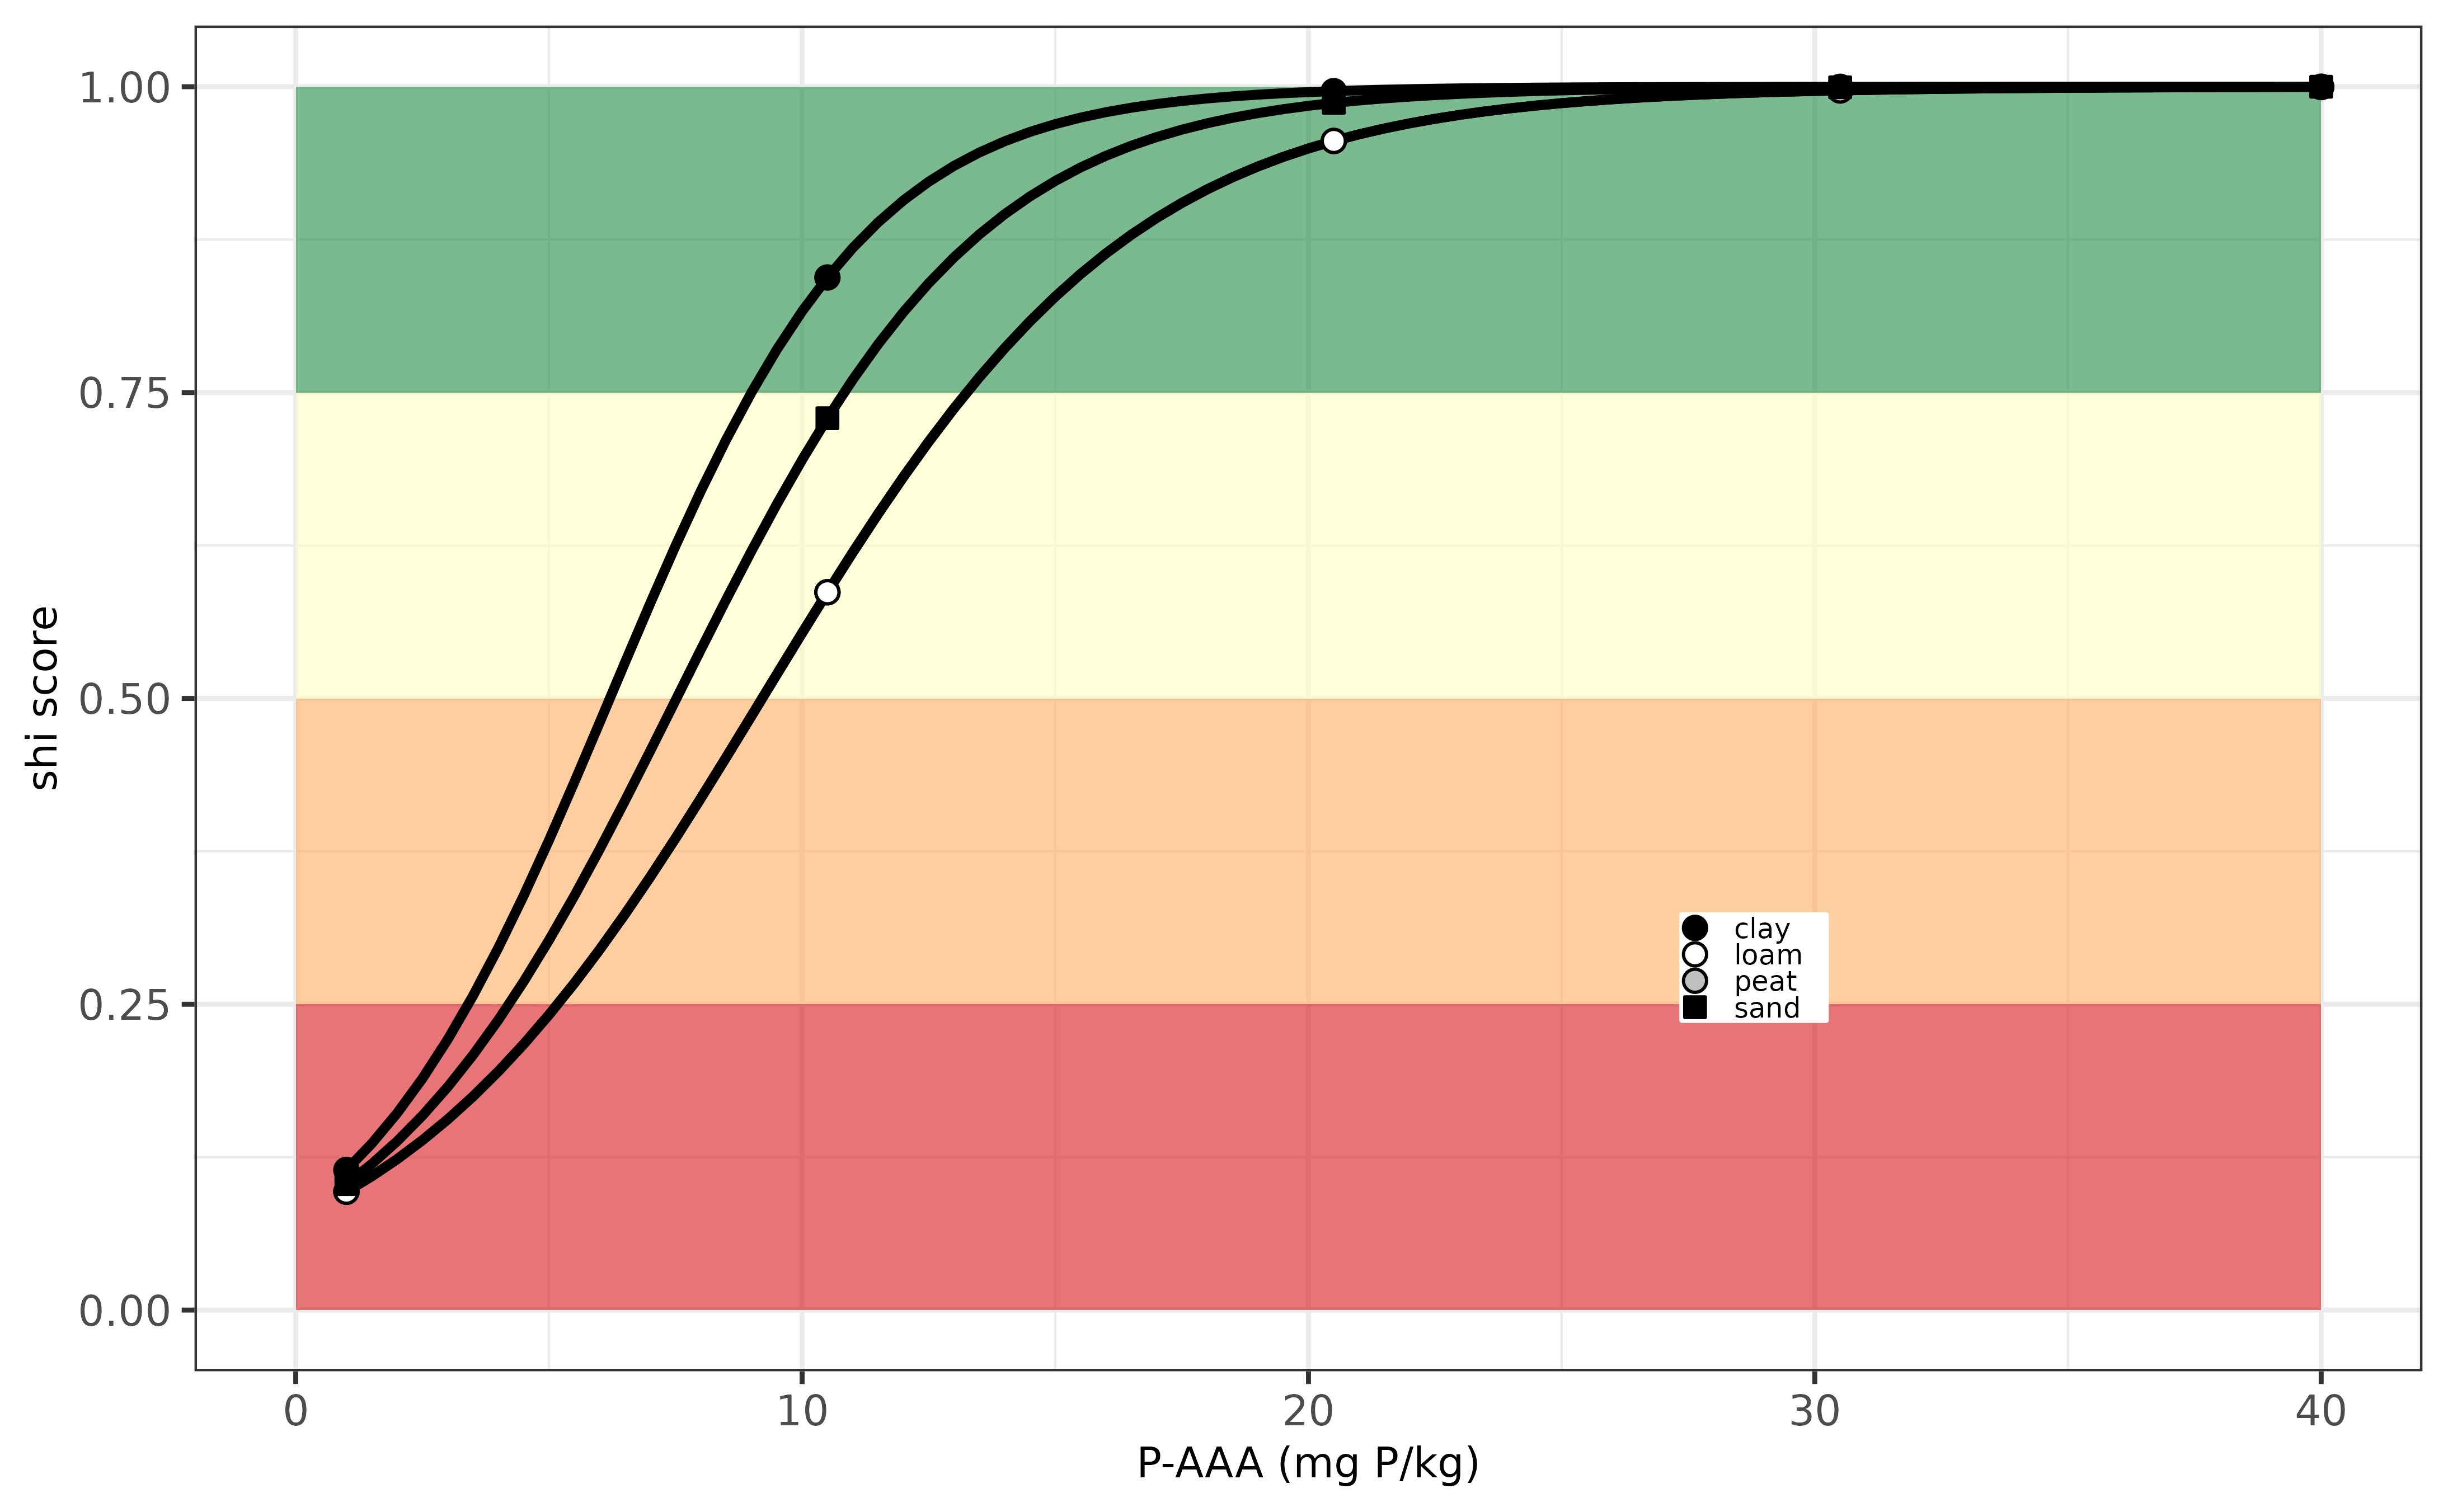
Evaluation P-indicator for Finland.
France (FR)
In France, soil phosphorus status for crop production is determined by assessing plant-available phosphorus levels, using the Olsen excration method. This soil P pool is then compared against thresholds specific to different crops, which vary based on factors like soil type and climate. In France the P supply can be assessed with varying degree of detail depending on the availability of regional threshold values. More information of the optimum threshold values and the soil P status evaluation can be found here.
The euosi package the soil health score for P supply can be
calculated with osi_c_phosphor_fr, requiring the following
inputs:
- B_LU, being the French crop code, an unique code for each crop. Both
original crop code and IACS codes are present in
osi_crops - A_P_OL, being the extracted P content with Olsen method, unit mg P /kg.
- A_PH_WA, being the soil acidity measured in water.
The soil pH is used to distinghuish between calcareous and non-calcareous soils. If not given, then the function assumes the soil is not calcareous.
| type | type | type |
|---|---|---|
| limons battants | limons lehm | aubues legeres et champagnes superficielles |
| limons argileux | hardt superficielle - ried brun caillouteux | aubues lourdes et champagnes profondes |
| argiles | hardt profonde - ried brun caillouteux | sableux |
| cranettes | argilo-calcaires caillouteux | argileux - superficiels |
| craie | limons argileux superficiels | terre noire |
| limons | limons hydromorphes | granitique |
| argilo-calcaire | argiles hydromorphes | sologne |
| sable | sols | varenne |
| argilo-calcaire superficiels | limons sableux | gravier-diluvium |
| argilo-calcaire profonds | sable caillouteux non calcareous | limon blanc sain |
| argiles lourdes | terres | limon blanc humide |
| limons loess | limons sains et limons sableux | limon argileux sain |
| alluvions | limon caillouteux superficiels | limon argileux humide |
| NA | NA | acides limoneux ou argileux |
For more information on the possible regions, see the table below.
| region | region | region | region |
|---|---|---|---|
| nord-picardie | franche-comte | haute normandie | auvergne |
| champagne ardenne | bourgogne | basse normandie | rhone alpes saone-et-loire |
| lorraine | centre limousin | bretagne pays de loire | sud quest |
| alsace | centre bassin parisien | poitou charents | auvergne |
| nord-picardie | franche-comte | haute marne | rhone alpes saone-et-loire |
An example of the osi_c_phosphor_fr function is
illustrated below for potato (crop code PTC) and permanent grassland
(code = PRL) for a single soil with P-content of 20 mg P / kg.
# show an example for soil P asssesment for potato crop (code = PTC) and grassland (code = PRL)
c(osi_c_phosphor_fr(B_LU = 'PTC', A_P_OL = 20),
  osi_c_phosphor_fr(B_LU = 'PRL', A_P_OL = 20))
## [1] 0.2517881 0.3999479Below the same example but then visualised for a series of soils with a P-Olsen value ranging from 0 to 30 mg P per kg (equal to 0 to 69 mg P2O5 /kg) for two crops: grassland and potato. From this example one can see that the soil health index score varies from very low to very high, depending on the content of P-Olsen (mg P/kg).
Evaluation P-indicator for France.
Hungary (HU)
The phosphorus supply in view of soil health for agricultural soils
in Hungary can be calculated using osi_c_phosphor_hu using
the following inputs:
- B_LU, being the crop code, an unique number for each crop
- A_SOM_LOI, being the soil organic matter content, in units percentage (%)
- A_CLAY_MI, being the clay content, in units percentage (%)
- A_CACO3_IF, being the carbonate content, in units percentage (%)
- A_P_AL, being the extracted P content with ammonium lactate, unit mg P /kg.
The P supplying capacity differs between carbonate and acidic soils (depending on carbonate content), between soils high or low in soil organic matter (the chernozem and other soil types), and between soils varying in soil texture (i.e. brown forest and sandys oils). Information on the threshold values for P-AL in view of sustainable crop production has been derived from Fotyma et al. (2008) who wrote a comprehensive overview of soil testing methods in Eastern Europe entitled “Soil testing methods and fertilizer recommendations in Central–Eastern European countries”.
Note that the crop codes for Hungary are not yet available in
osi_crops package table.
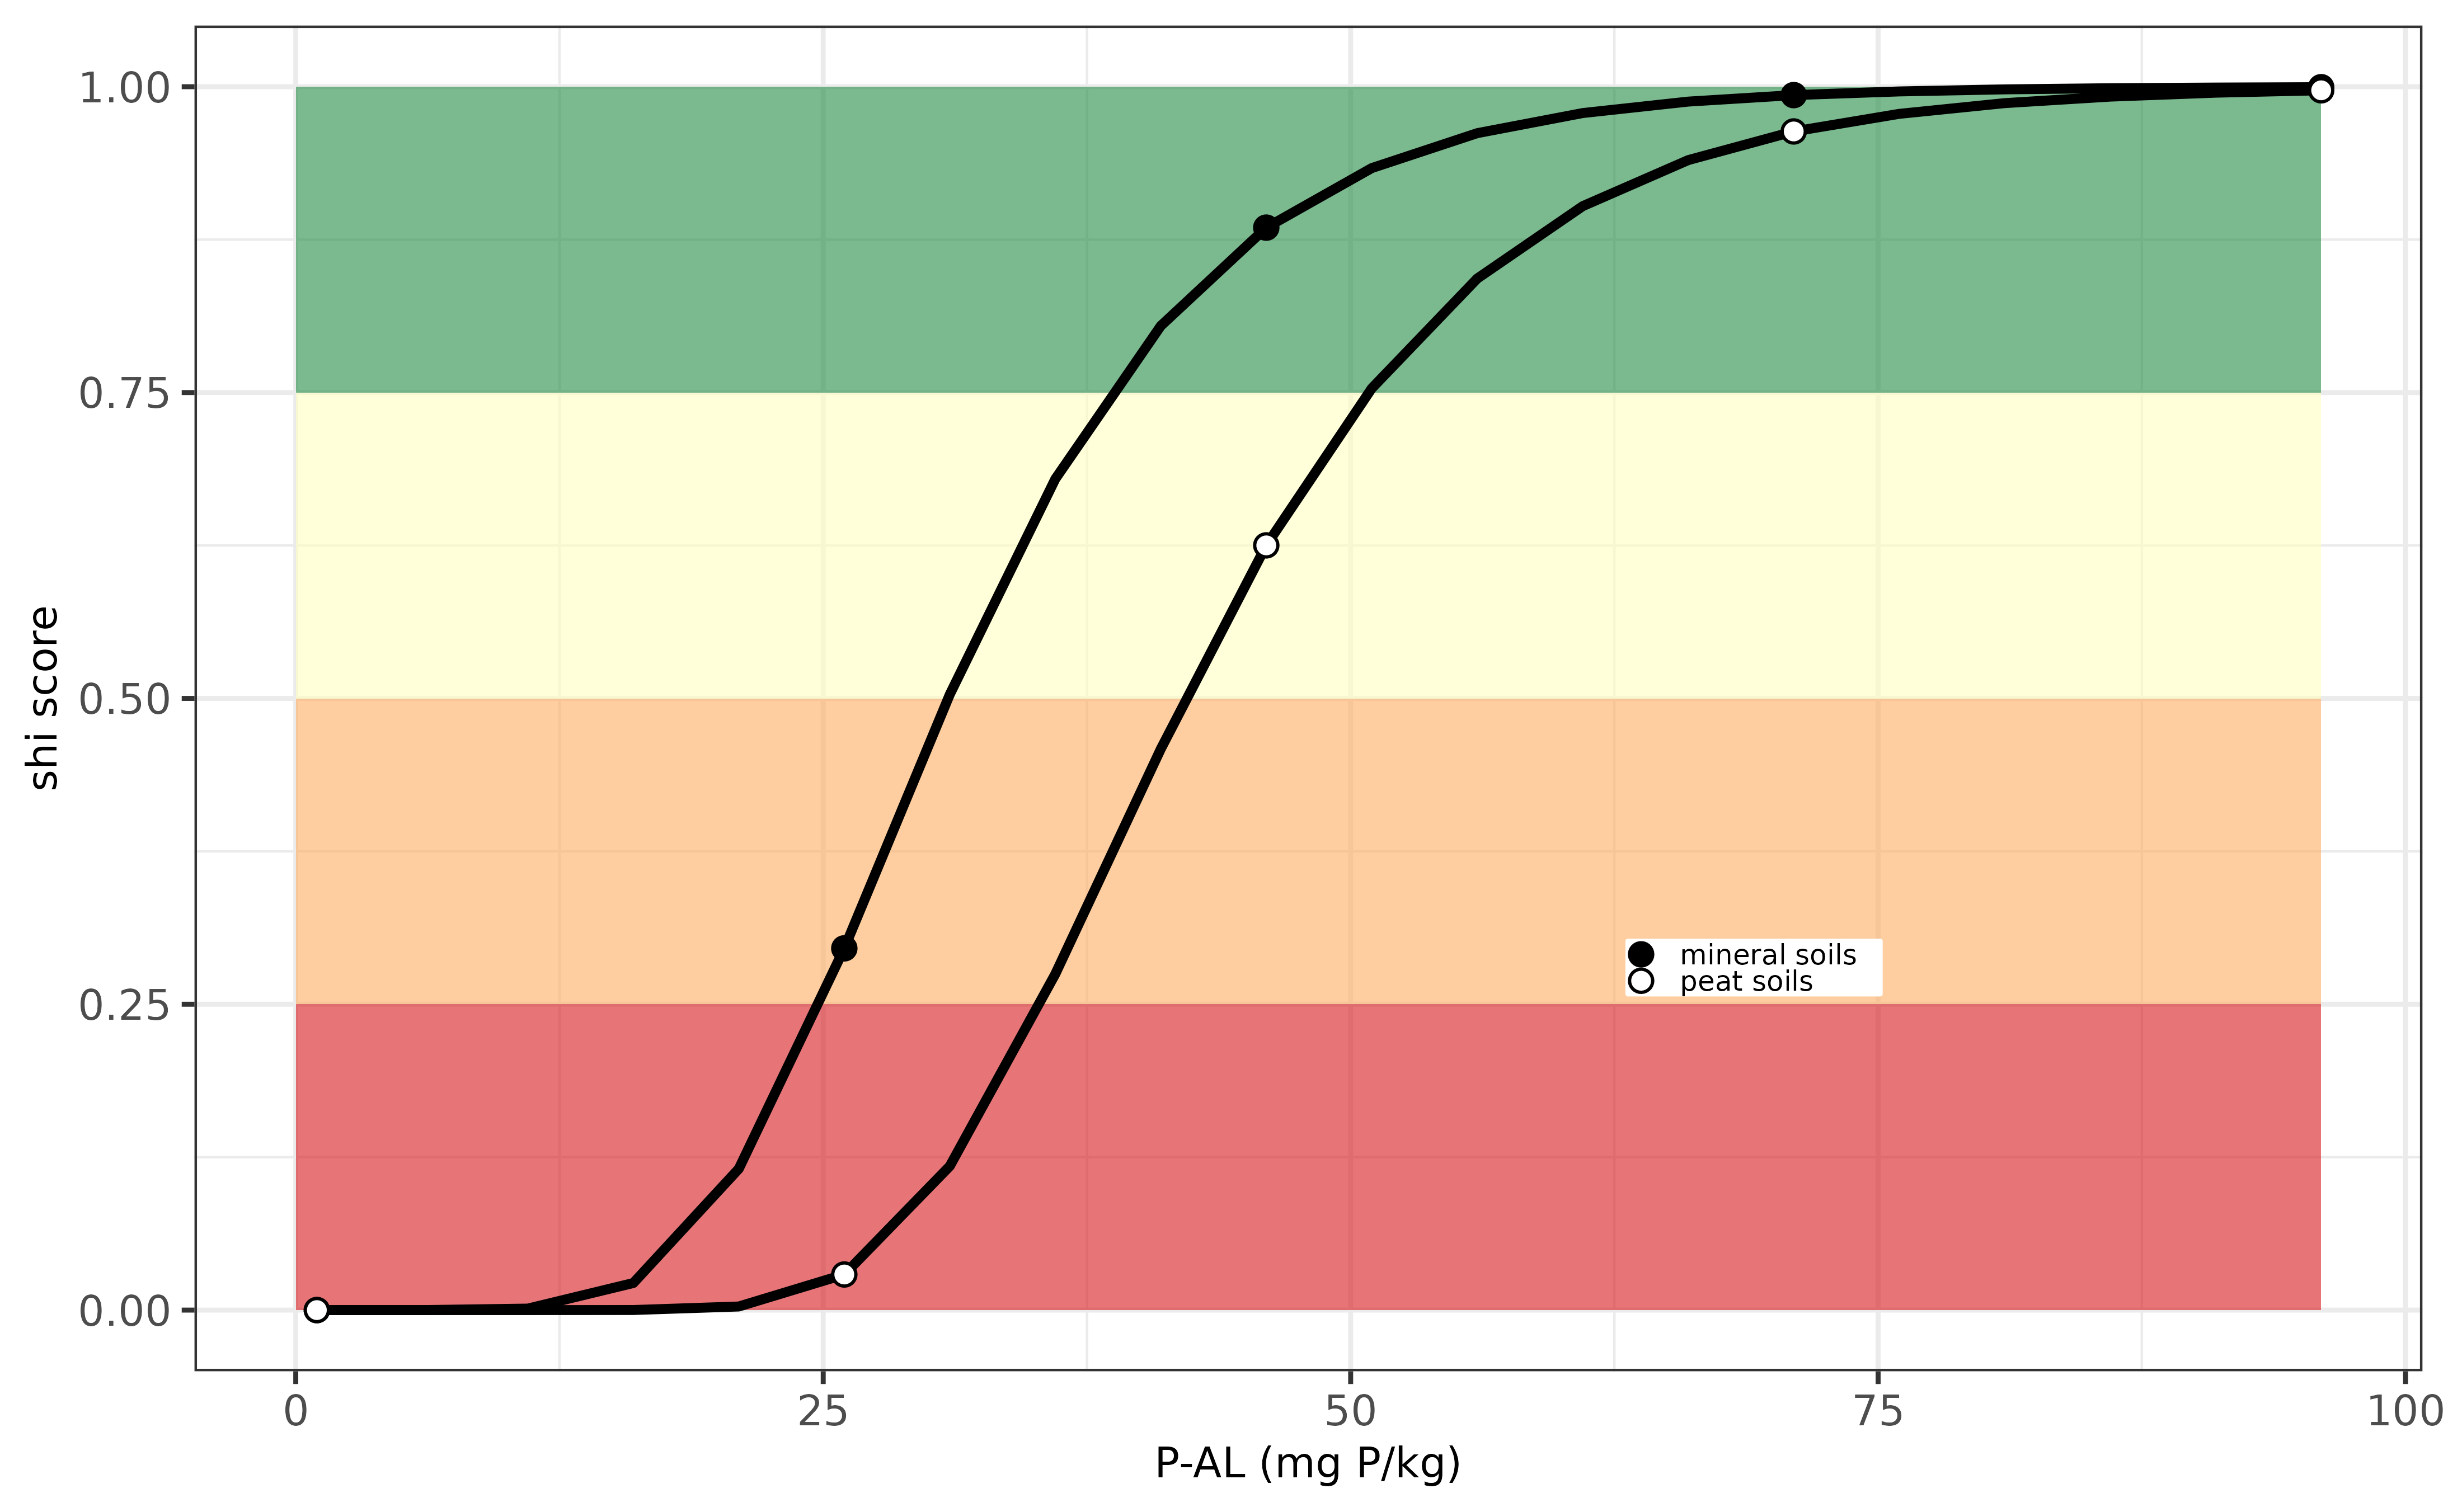
Below an example is visualized how the soil health index varies in relation to variation in P-AL. The optimum soil P threshold value for sustainable crop production is around 120 mg P/ kg for both soil types (peat and mineral soils), and the soil index rapidly decreases when P-AL values decreases down to 60 mg P/kg.

Evaluation P-indicator for Hungary.
Ireland (IE)
The phosphorus supply in view of soil health for agricultural soils
in Ireland can be calculated using osi_c_phosphor_ie using
the following inputs:
- B_LU, being the crop code, an unique number for each crop
- A_P_OL, being the extracted P content with the Olsen method, unit mg P /kg
The P supplying capacity differs among soil textures, but in Ireland the evaluation of the P supply is similar for all soil types but it varies for grassland and crop land. Information on the threshold values for P-Olsen in view of sustainable crop production can be found on the website of Teagasc
Note that the crop codes for Ireland are not yet available in
osi_crops package table. For now, the B_LU code is used to
differentiate between grassland and cropland.
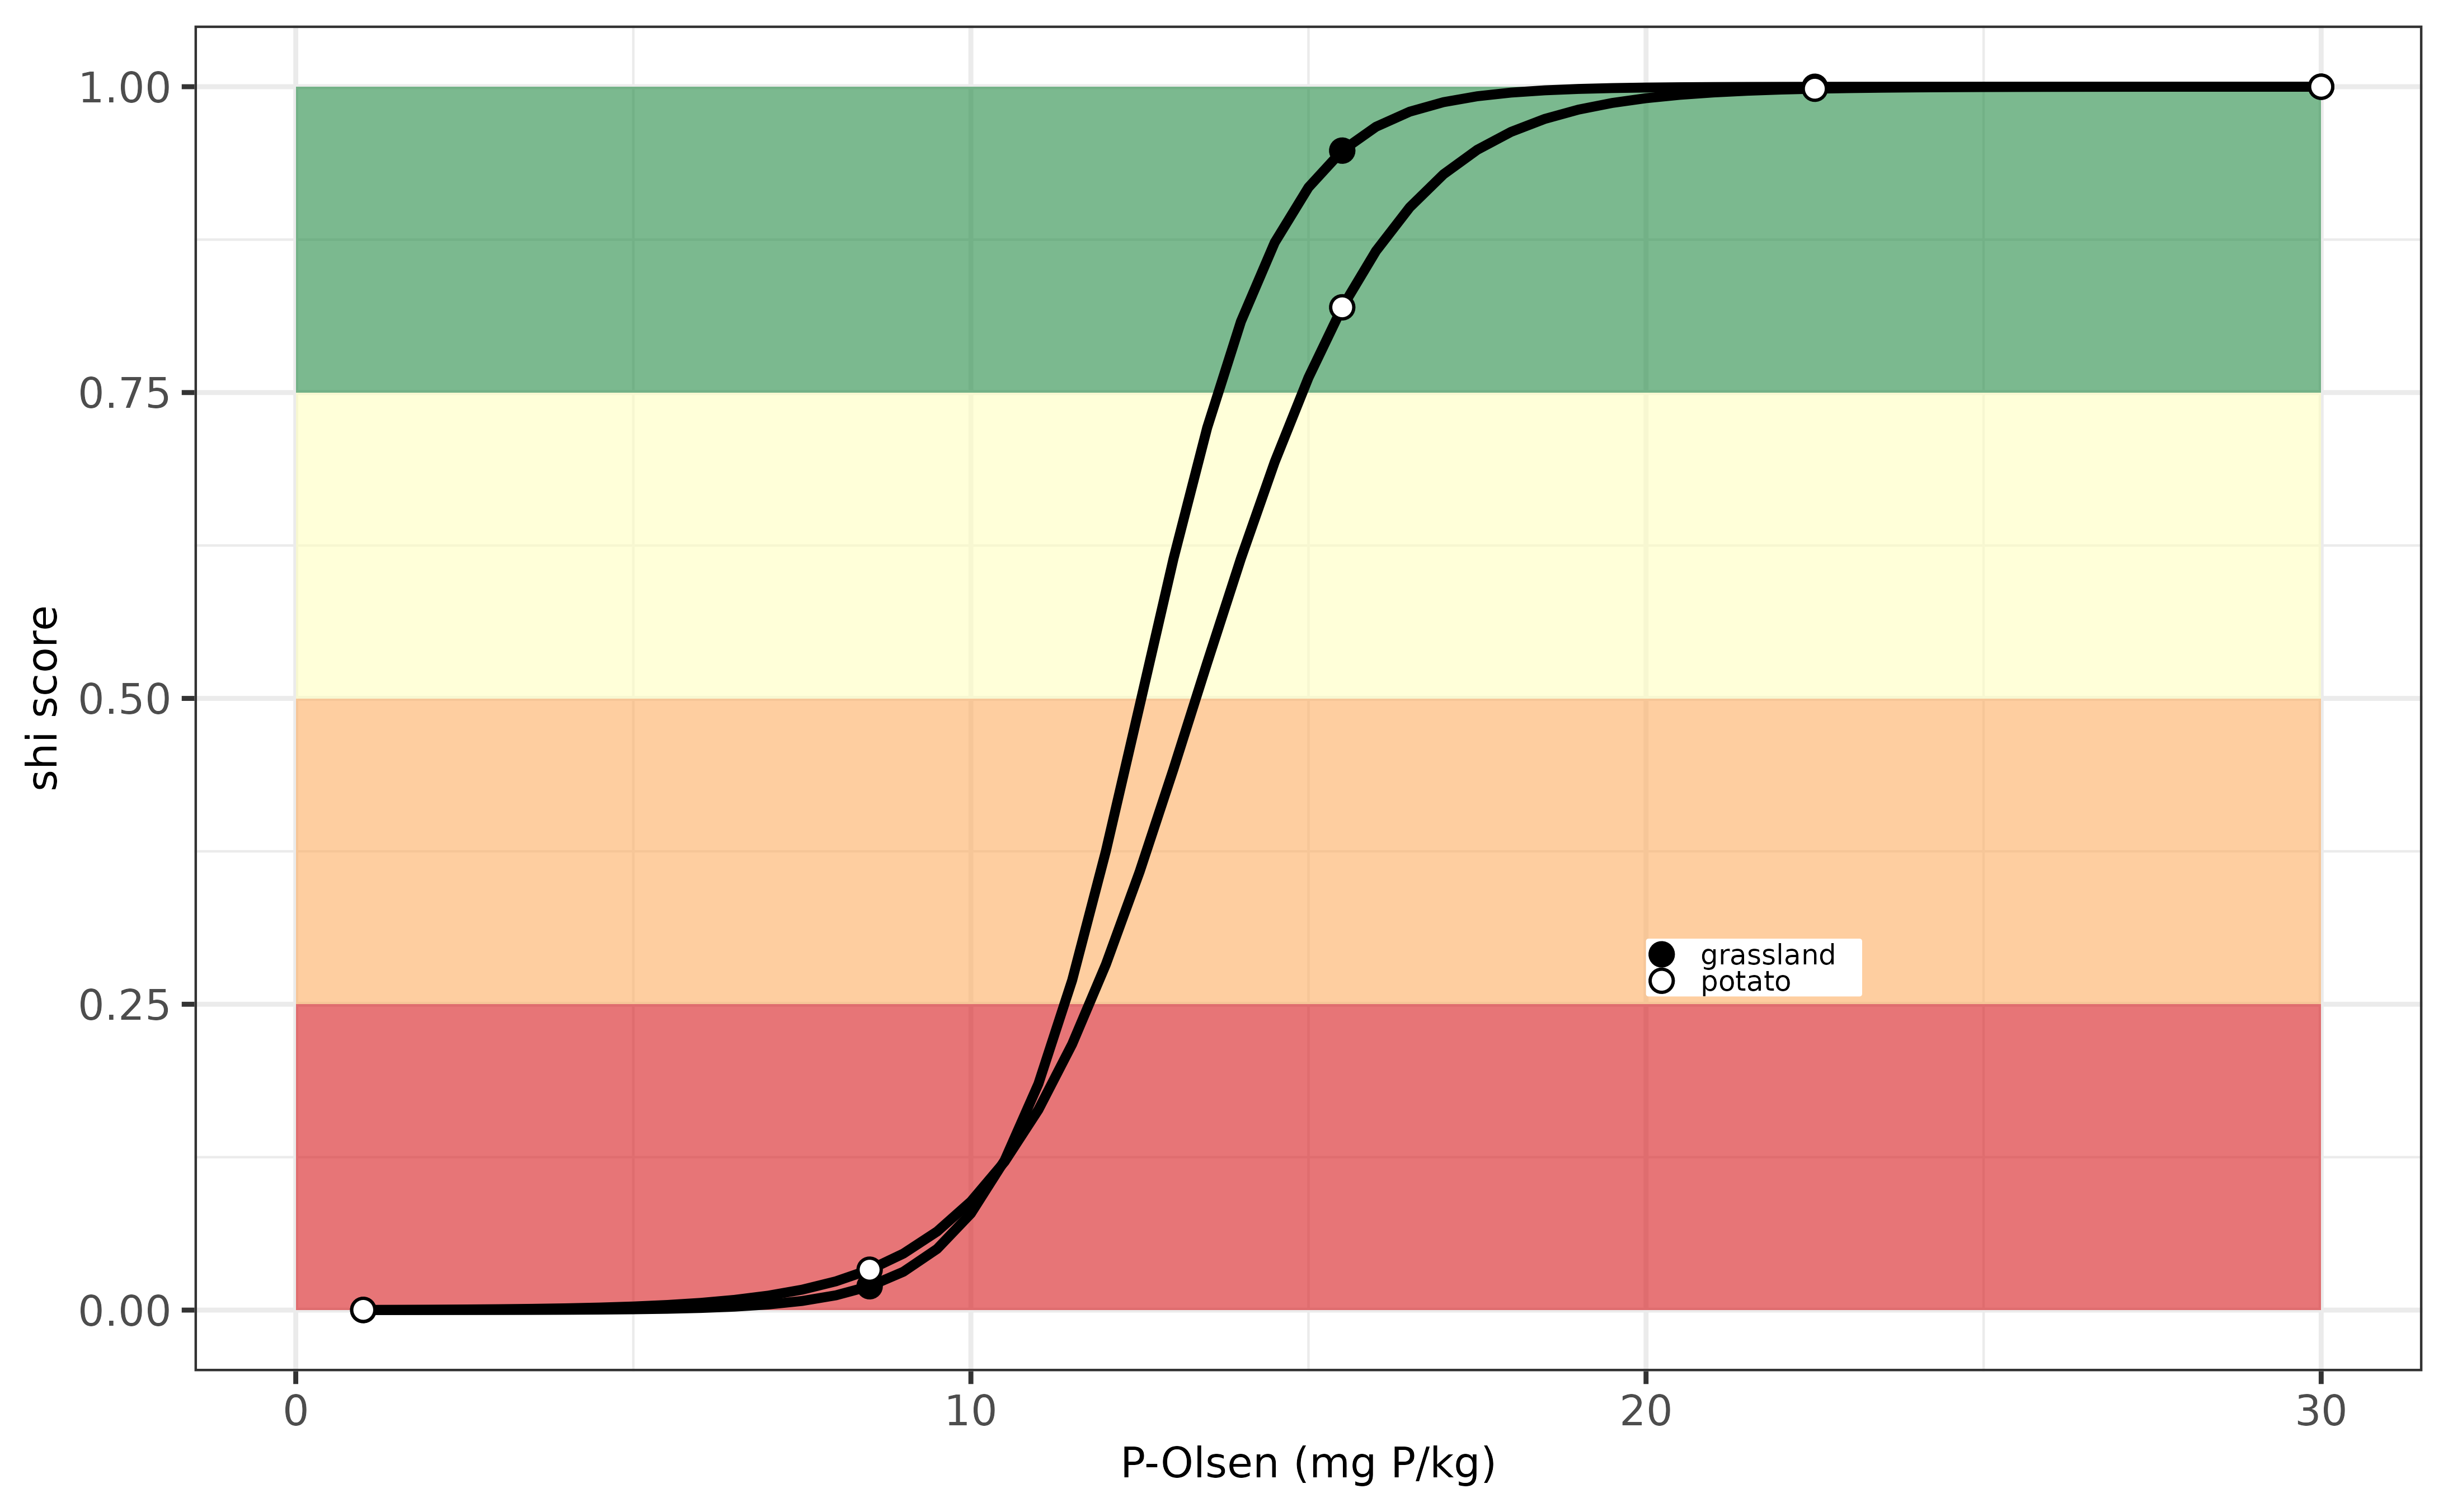
Below an example is visualized how the soil health index varies in relation to variation in P-Olsen. The optimum soil P threshold value for sustainable crop production is around 15 mg P/ kg for both land uses. Phosphorus deficiency occurs when the P-OL value decreases below around 7.5 mg P/kg.
Evaluation P-indicator for Ireland.
Italy (IT)
The phosphorus supply in view of soil health for agricultural soils
in Italy can be calculated using osi_c_phosphor_it using
the following inputs:
- B_LU, being the crop code, an unique number for each crop
- A_P_OL, being the extracted P content with the Olsen method, unit mg P /kg
The evaluation of the P supply is similar for all soil types and land uses. Information on the threshold values for P-Olsen in view of sustainable crop could not be retreived from Italian fertilizer guidelines (follow up action with Italian partners needed) and has been retreived from te paper of Steinfurth et al (2022) that can be found here.
Note that IACS crop codes for Italy are available in
osi_crops package table.
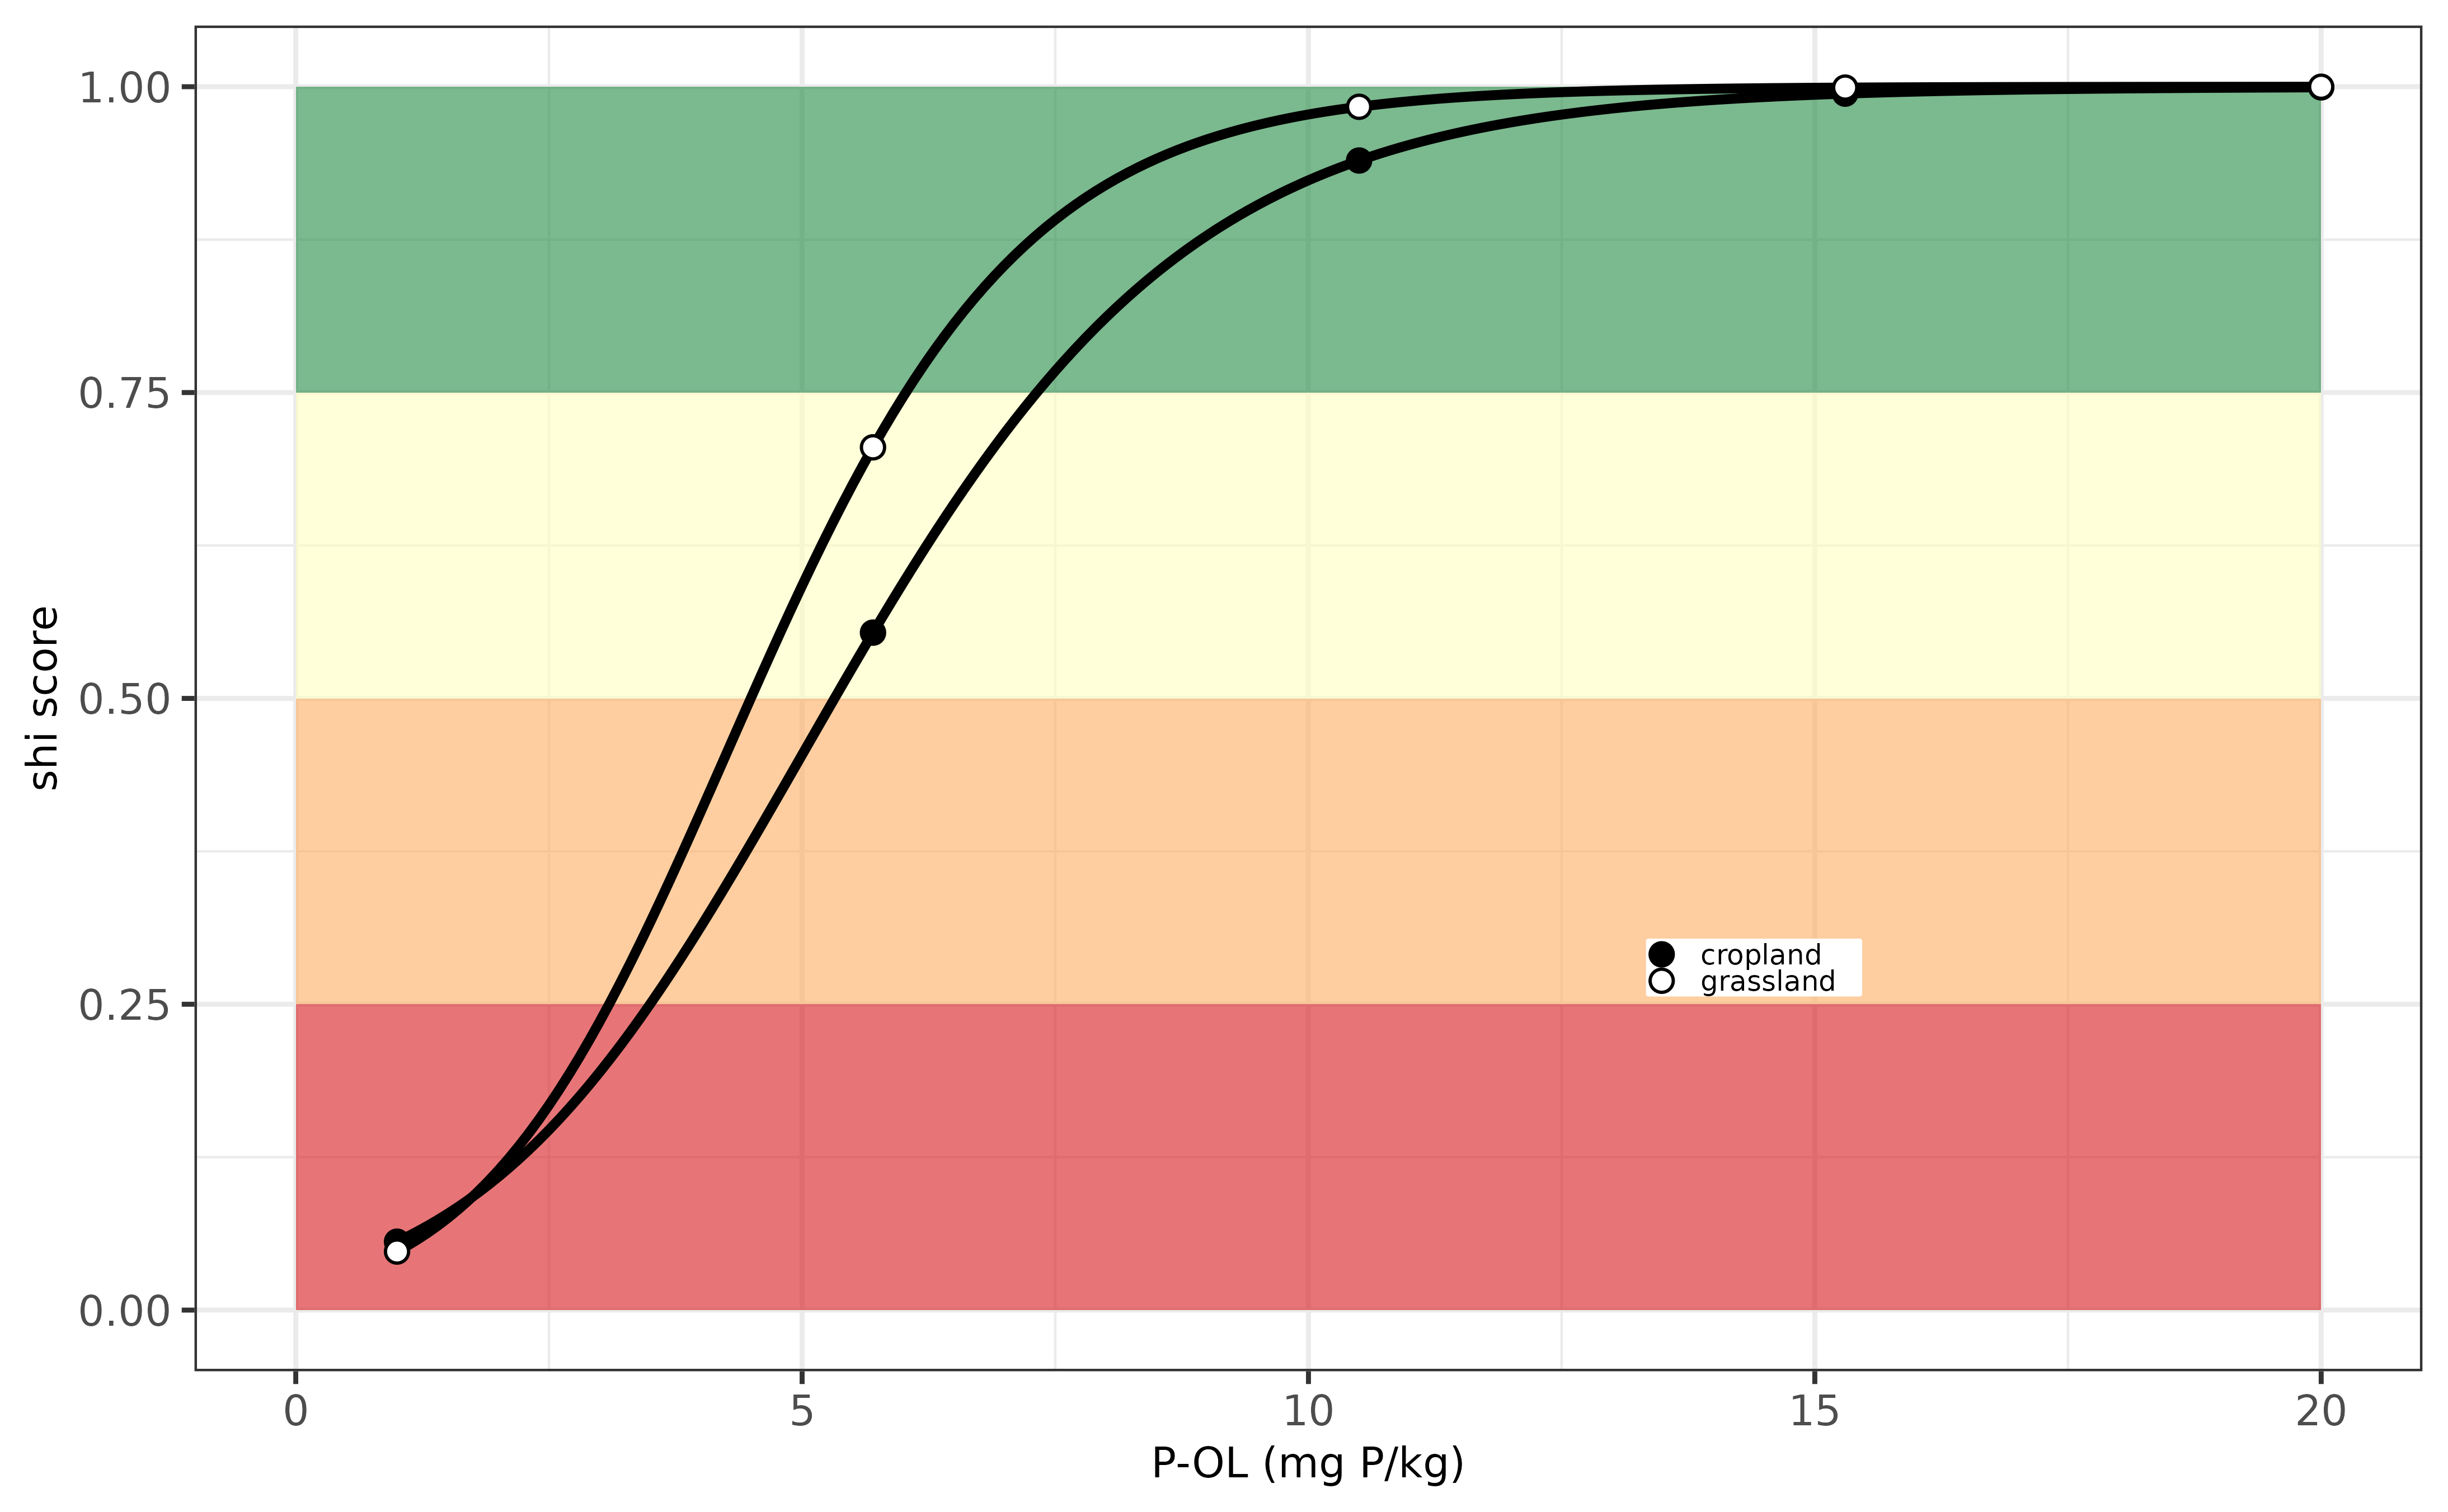
Below an example is visualized how the soil health index varies in relation to variation in P-Olsen. The optimum soil P threshold value for sustainable crop production is around 10-15 mg P/ kg for both land uses. Phosphorus deficiency occurs when the P-OL value decreases below around 5 mg P/kg.
Evaluation P-indicator for Italy.
Latvia (LV)
The phosphorus supply in view of soil health for agricultural soils
in Latvia can be calculated using osi_c_phosphor_lv using
the following inputs:
- B_LU, being the crop code, an unique number for each crop
- B_TEXTURE_USDA, being the soil texture class according to USDA classification system
- A_P_DL, being the extracted P content with Double Lactate extraction, unit mg P /kg.
The P supplying capacity differs in soils with varying textures.
Based on the soil mineralogy (clay, sand and silt content) one can
easily classify the USDA texture class using
osi_get_TEXTURE_USDA. Information on the threshold values
for P-DL in view of sustainable crop production has been derived from
Fotyma et al. (2008) who wrote a comprehensive overview of soil testing
methods in Eastern Europe entitled “Soil testing methods and fertilizer
recommendations in Central–Eastern European countries”.
Note that the crop codes for Latvia are not yet available in
osi_crops package table.
Below an example is visualized how the soil health index varies in relation to variation in P-DL. The optimum soil P threshold value for sustainable crop production is around 60 mg P/ kg for the three soil types evaluated (clay, sand and loam), and the soil index rapidly decreases when P-DL values decreases down to 10-20 mg P/kg.
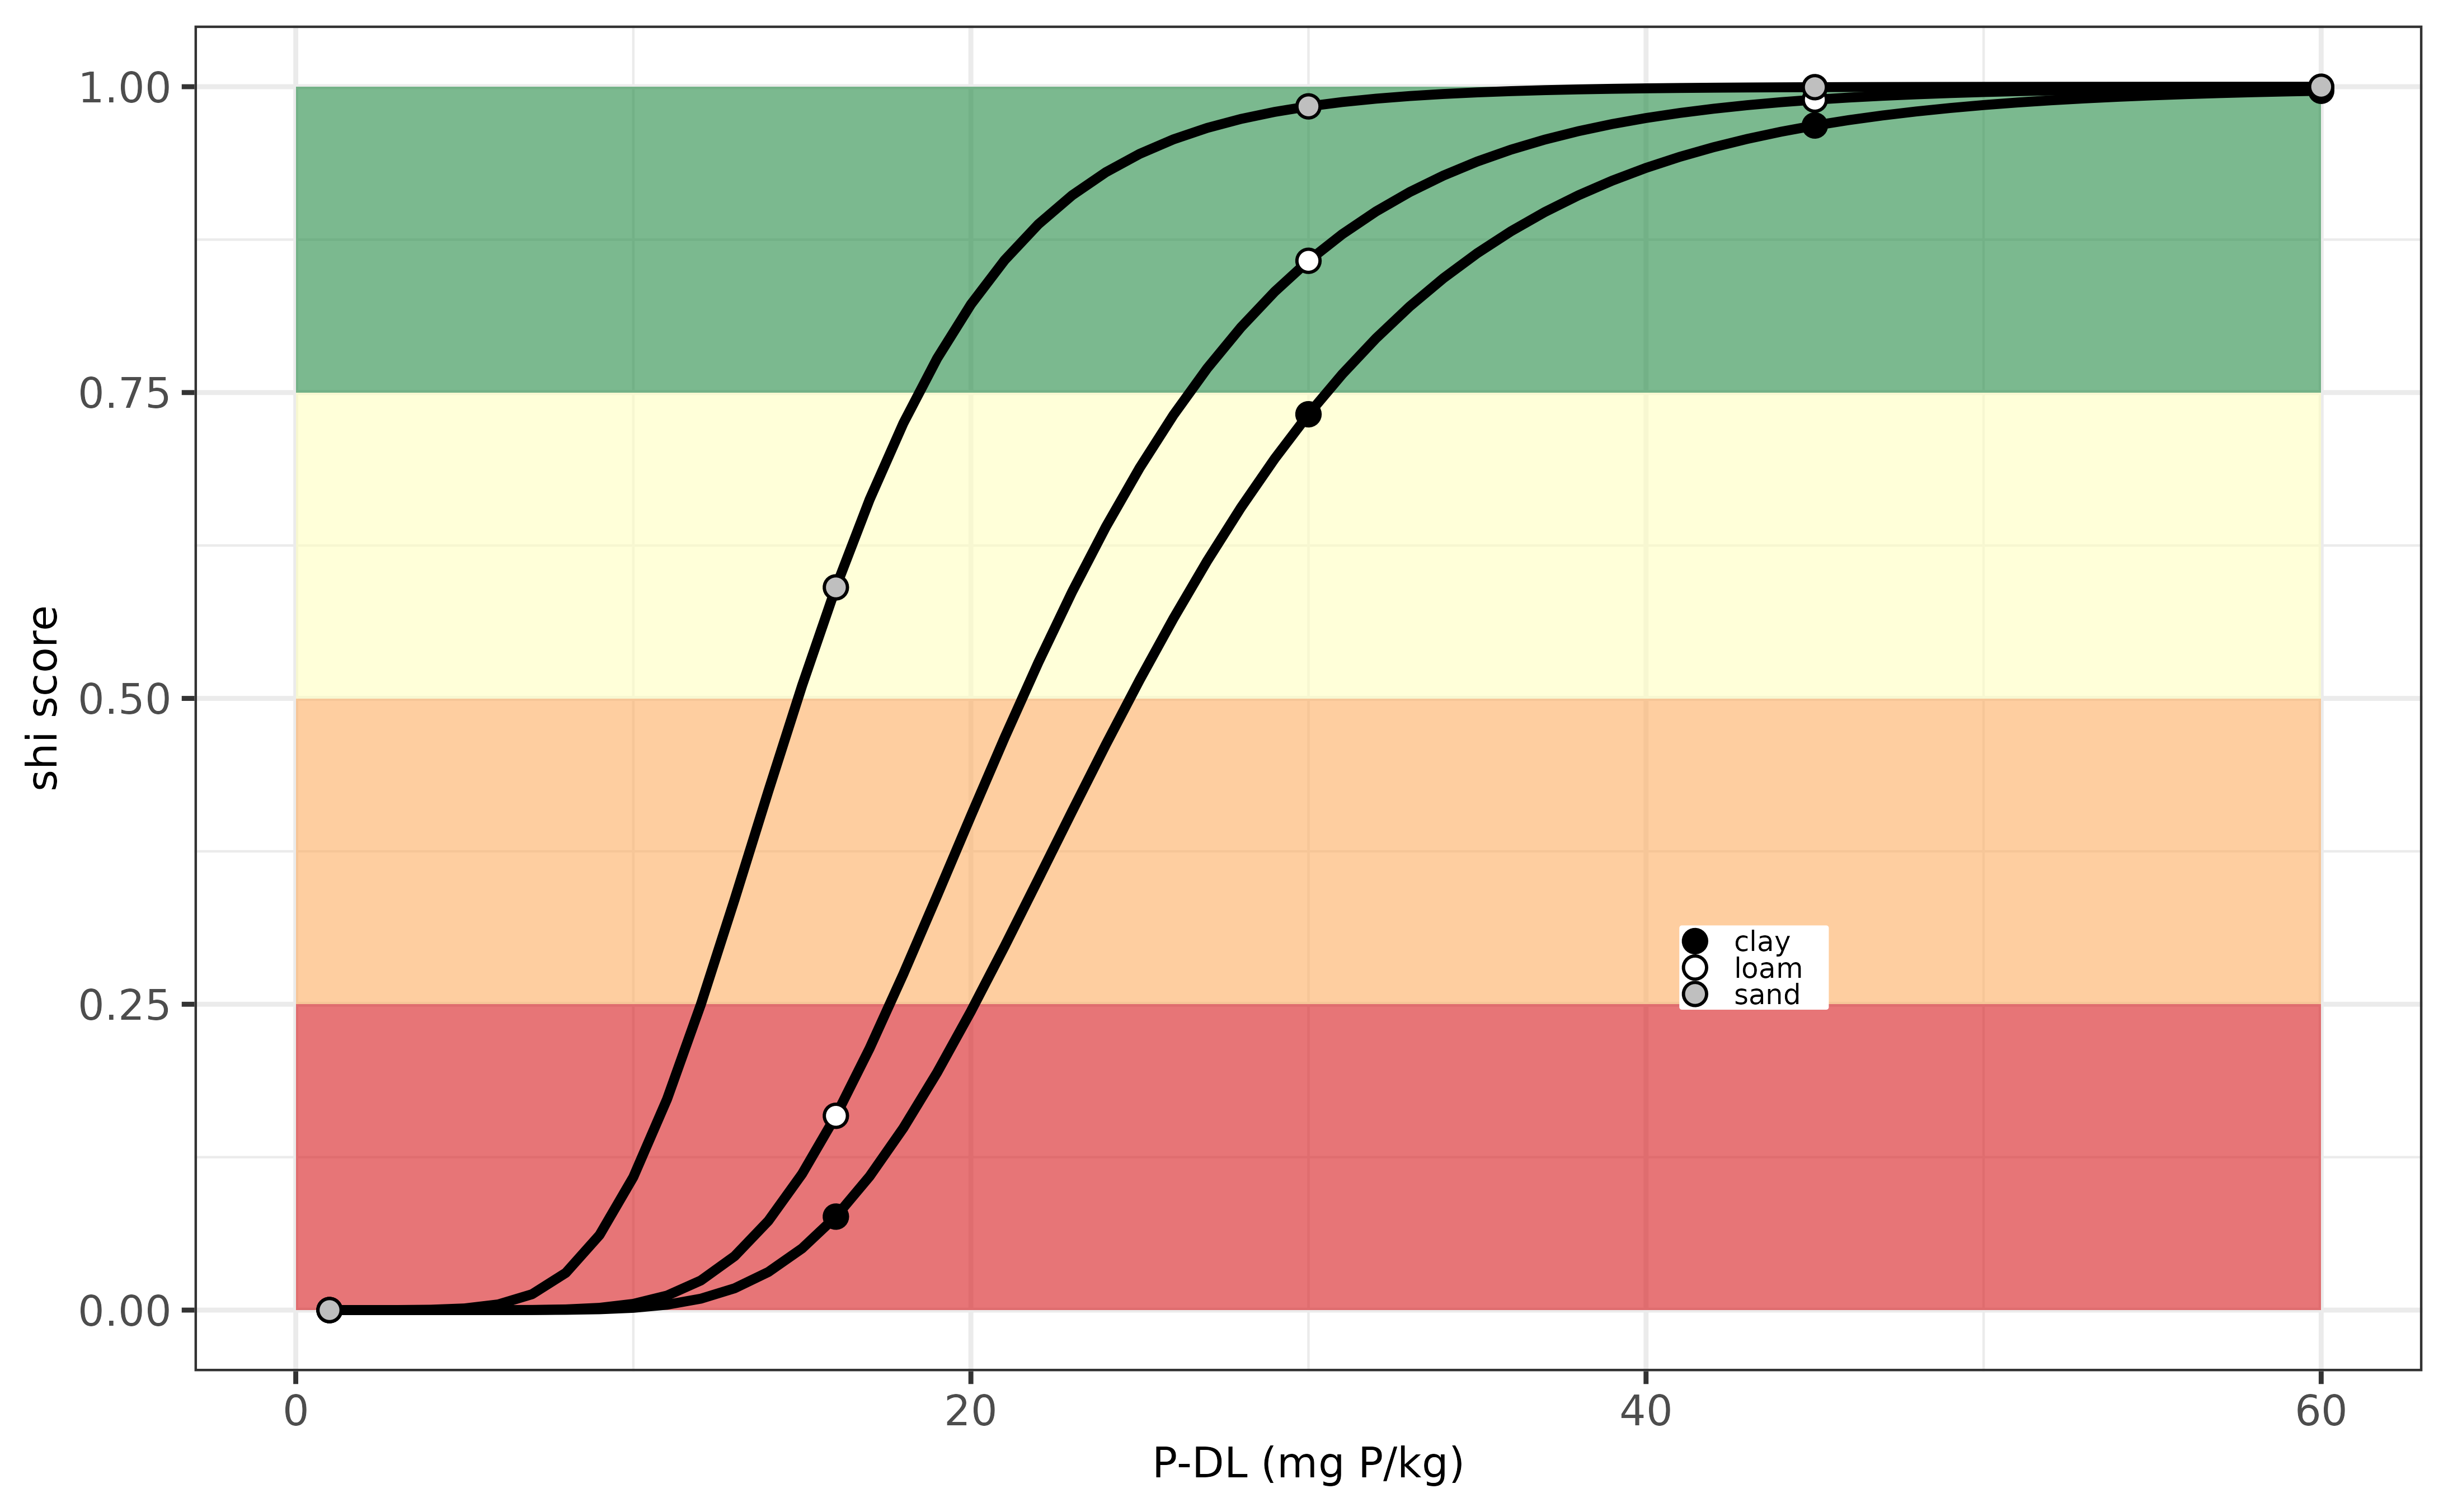
Evaluation P-indicator for Latvia.
Lithuania (LT)
The phosphorus supply in view of soil health for agricultural soils
in Lithuania can be calculated using osi_c_phosphor_lt
using the following inputs:
- B_LU, being the crop code, an unique number for each crop
- A_SOM_LOI, being the soil organic matter content, in units percentage (%)
- A_P_AL, being the extracted P content with ammonium lactate, unit mg P /kg.
The P supplying capacity differs between peaty soils (having high levels of soil organic matter) and mineral soils. Information on the threshold values for P-AL in view of sustainable crop production has been derived from Fotyma et al. (2008) who wrote a comprehensive overview of soil testing methods in Eastern Europe entitled “Soil testing methods and fertilizer recommendations in Central–Eastern European countries”.
Note that the crop codes for Lithuania are not yet available in
osi_crops package table.
Below an example is visualized how the soil health index varies in relation to variation in P-AL. The optimum soil P threshold value for sustainable crop production is around 75 mg P/ kg for both soil types (peat and mineral soils), and the soil index rapidly decreases when P-AL values decreases down to 30 mg P/kg.
Evaluation P-indicator for Lithuania.
Netherlands (NL)
The phosphorus supply for grassland and maize fields is quantified based on soil P reserves (determined with ammonium lactate extraction) and plant available P (determined with CaCl2 extraction), where the optimum P supply is derived from multiple field experiments across the Netherlands. For arable fields, the phosphorus supply is approximated with water-extractable P, which reflect P availability controlled by chemical sorption and desorption equilibria and affected by the iron and aluminum oxides content of soils. The P supply is evaluated with a more-is-better logistic scoring function, which reaches the maximum score when the phosphorus supply is around 4.8 (unitless index, for maize and grassland fields) and 45 (mg P2O5 per liter, for arable fields). More information for grasland and maize can be found here and for arable crops can be found here.
In the euosi package the P indicator for the Netherlands can be
estimated via osi_c_phosphor_nl. This function requires the
following inputs:
- B_LU, being the Dutch BRP code, an unique number for each crop
- A_P_AL, being the extracted P content with ammonium lactate, unit mg P /kg (internally converted to the unit mg P2O5/100g as being used in the Dutch context).
- A_P_CC, being the extracted P content with 0.01M CaCl2, unit mg P/kg.
- A_P_WA, being the extracted P content with water, unit mg P/kg (internally converted to the unit mg P2O5/L as being used in the Dutch context).
An example is illustrated below for a maize crop (crop code 265) and a single soil is:
# show an example for maize crop
osi_c_phosphor_nl(B_LU = 265, A_P_AL = 197, A_P_CC = 2.5,A_P_WA=85)
## [1] 0.9067799Below the same example but then visualised for a series of soils with a single P-AL value (of 45 mg P2O5/100g) and a variable P-CaCl2 value (ranging from 0.1 to 10 mg P /kg). This is done for two crops: grassland and maize. From this example one can see that the soil health index score varies from very low to very high, depending on the content of P-CaCl2.
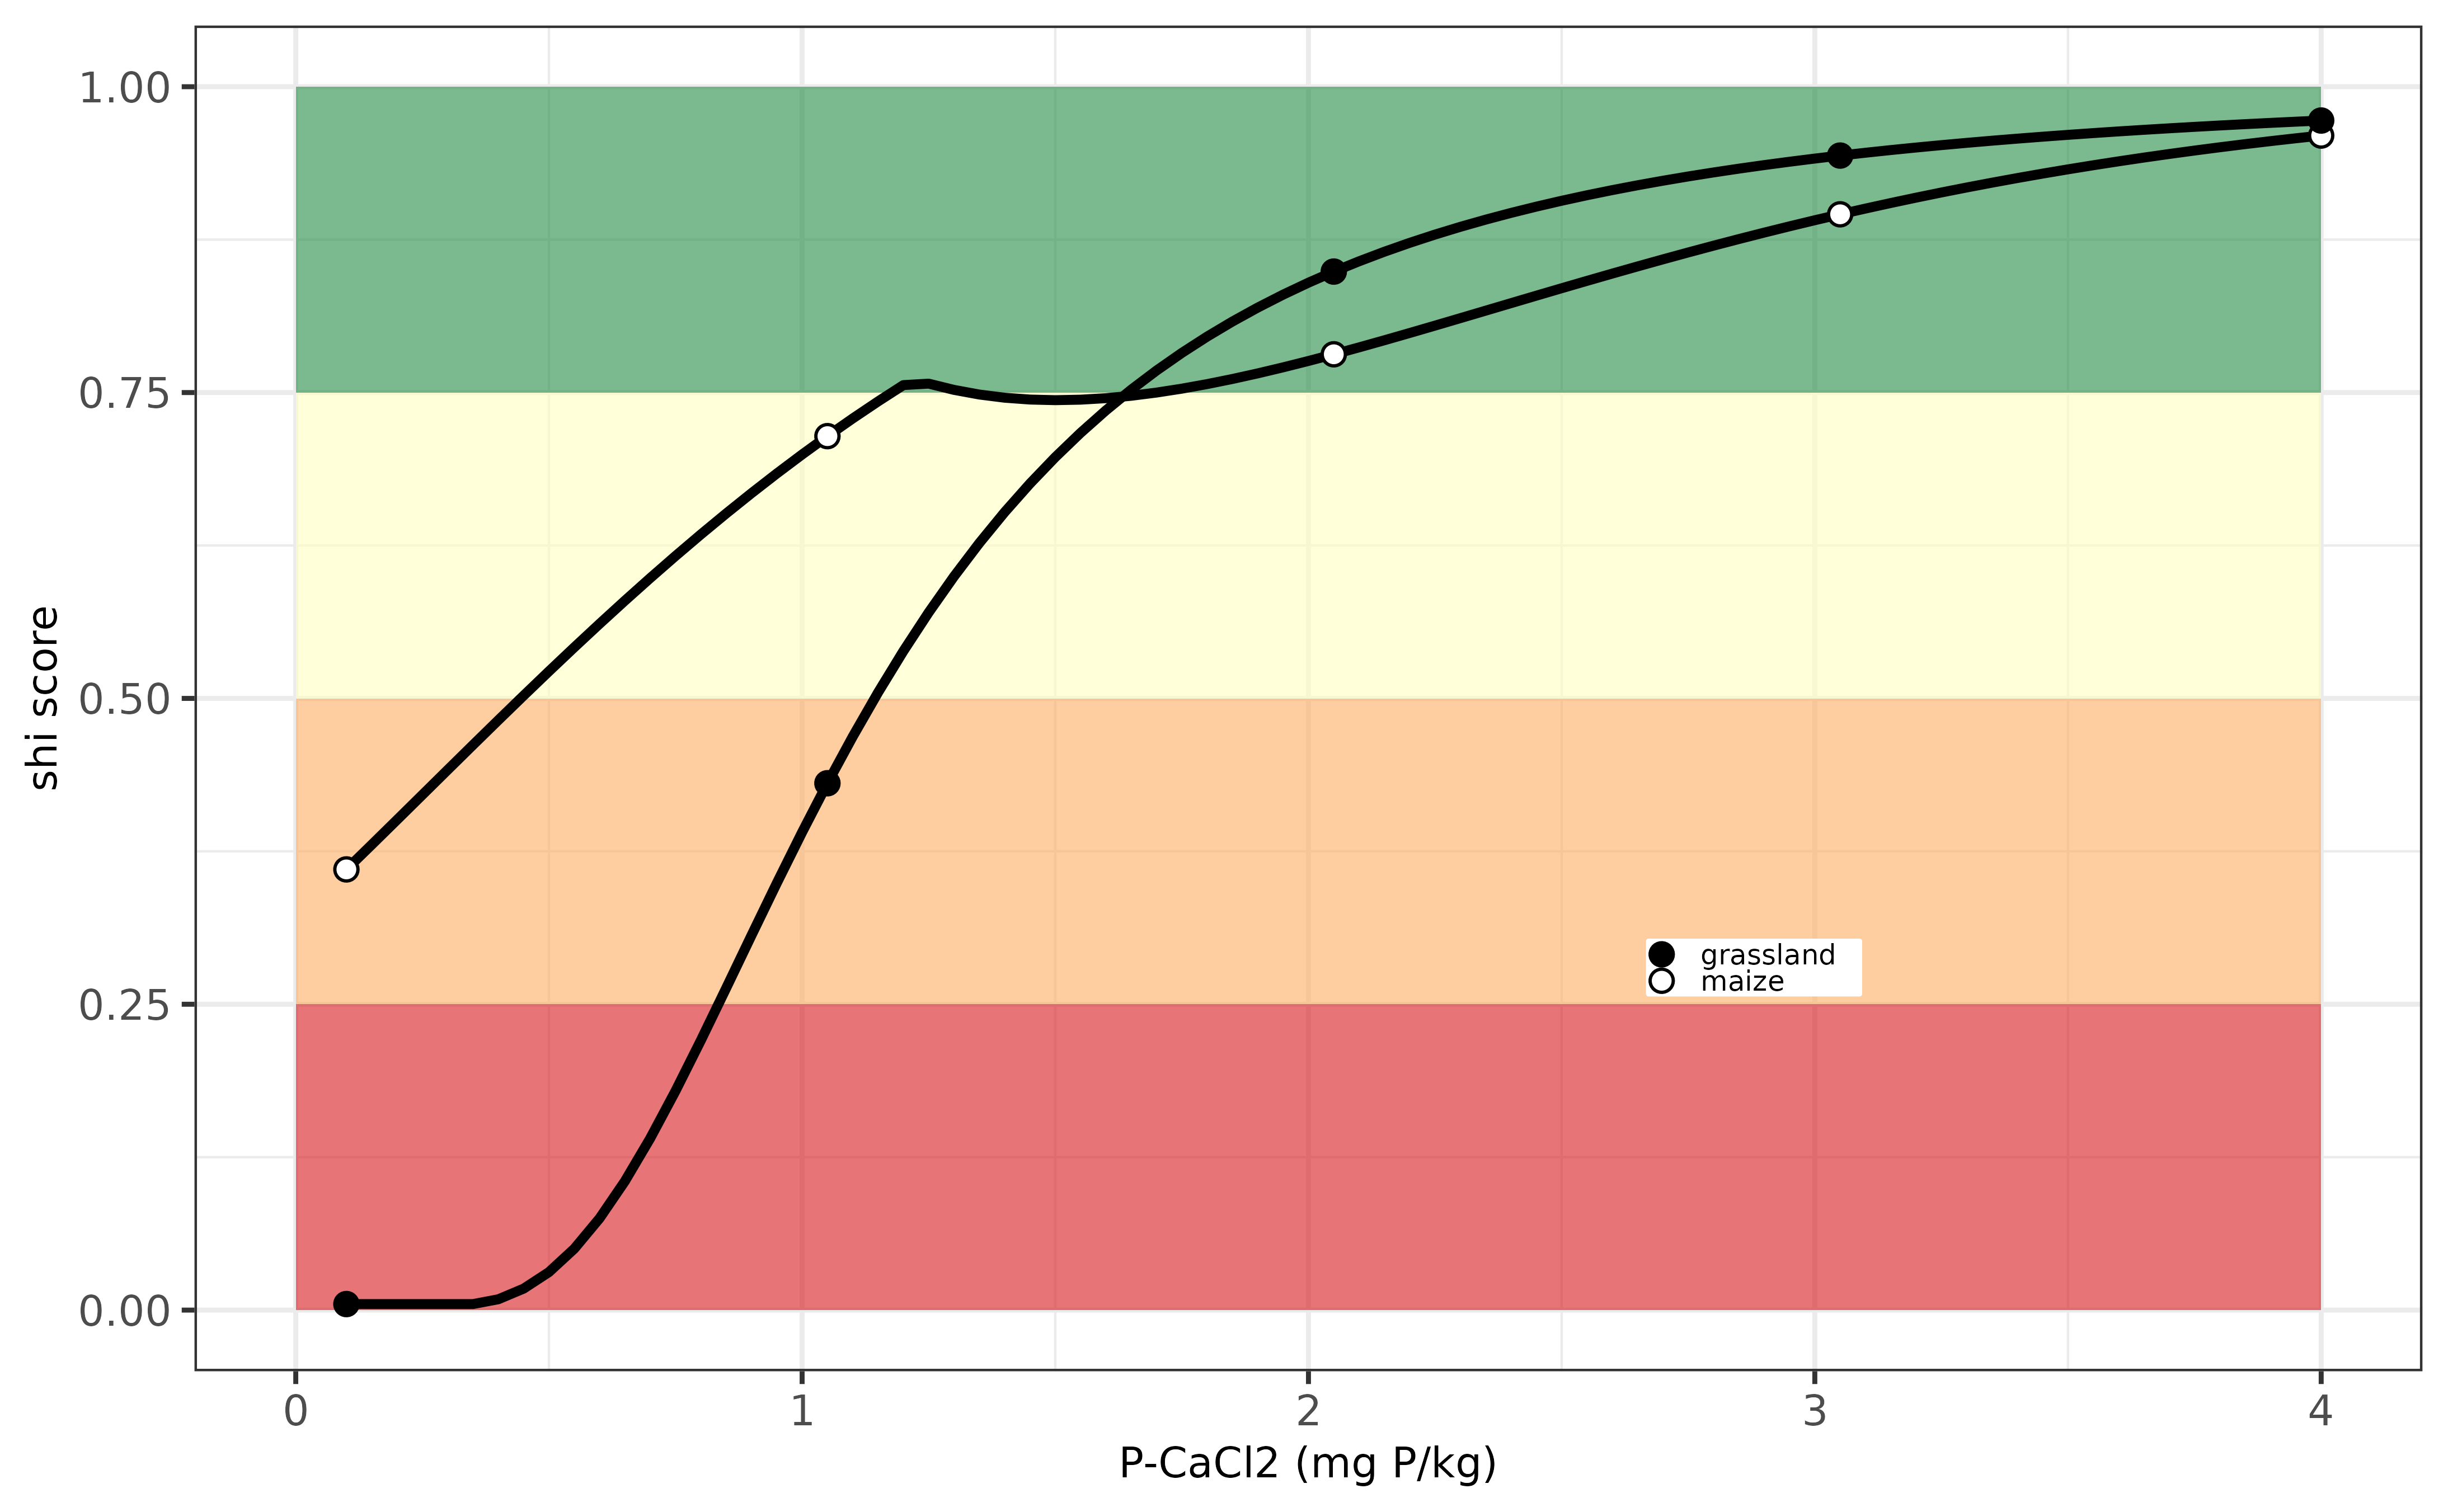
Evaluation P-indicator for the Netherlands.
Norway (NO)
The phosphorus supply in view of soil health for agricultural soils
in Norway can be calculated using osi_c_phosphor_no using
the following inputs:
- B_LU, being the crop code, an unique number for each crop
- A_P_AL, being the extracted P content with ammonium lactate extraction, unit mg P /kg
The P supplying capacity differs among soil textures, but here the evaluation of the P supply is similar for all soil types and land uses.The Norwegian fertilizer documentation has not been retreived yet, but option thresholds are taken from Krogstat et al. (2008) entitled “New P recommendations for grass and cereals in Norwegian agriculture” (as being referred to by the paper of Steinfurth et al. (2022) that can be found here).
Note that the crop codes for Norway are not yet available in
osi_crops package table.
Below an example is visualized how the soil health index varies in relation to variation in P-AL. The optimum soil P threshold value for sustainable crop production is around 50 mg P/ kg. Phosphorus deficiency occurs when the P-OL value decreases below around 25 mg P/kg.

Evaluation P-indicator for Norway.
Poland (PL)
The phosphorus supply in view of soil health for agricultural soils
in Poland can be calculated using osi_c_phosphor_pl using
the following inputs:
- B_LU, being the crop code, an unique number for each crop
- A_P_DL, being the extracted P content with Double Lactate extraction, unit mg P /kg.
Information on the threshold values for P-DL in view of sustainable crop production has been derived from Fotyma et al. (2008) who wrote a comprehensive overview of soil testing methods in Eastern Europe entitled “Soil testing methods and fertilizer recommendations in Central–Eastern European countries”.
Note that the crop codes for Poland are not yet available in
osi_crops package table.
Below an example is visualized how the soil health index varies in relation to variation in P-DL. The optimum soil P threshold value for sustainable crop production is around 65 mg P/ kg, and the soil index decreases when P-DL values decreases down to 30 mg P/kg.

Evaluation P-indicator for Poland.
Portugal (PT)
The phosphorus supply in view of soil health for agricultural soils
in Portugal can be calculated using osi_c_phosphor_pt using
the following inputs:
- B_LU, being the crop code, an unique number for each crop
- A_P_OL, being the extracted P content with the Olsen method, unit mg P /kg.
Information on the threshold values for P-OL in view of sustainable
crop production has been derived from the Portugese fertilizer manual
entitled Manual de fertilização das culturas, a document
that can be downloaded here.
Note that IACS crop codes for Portugal are available in
osi_crops package table.
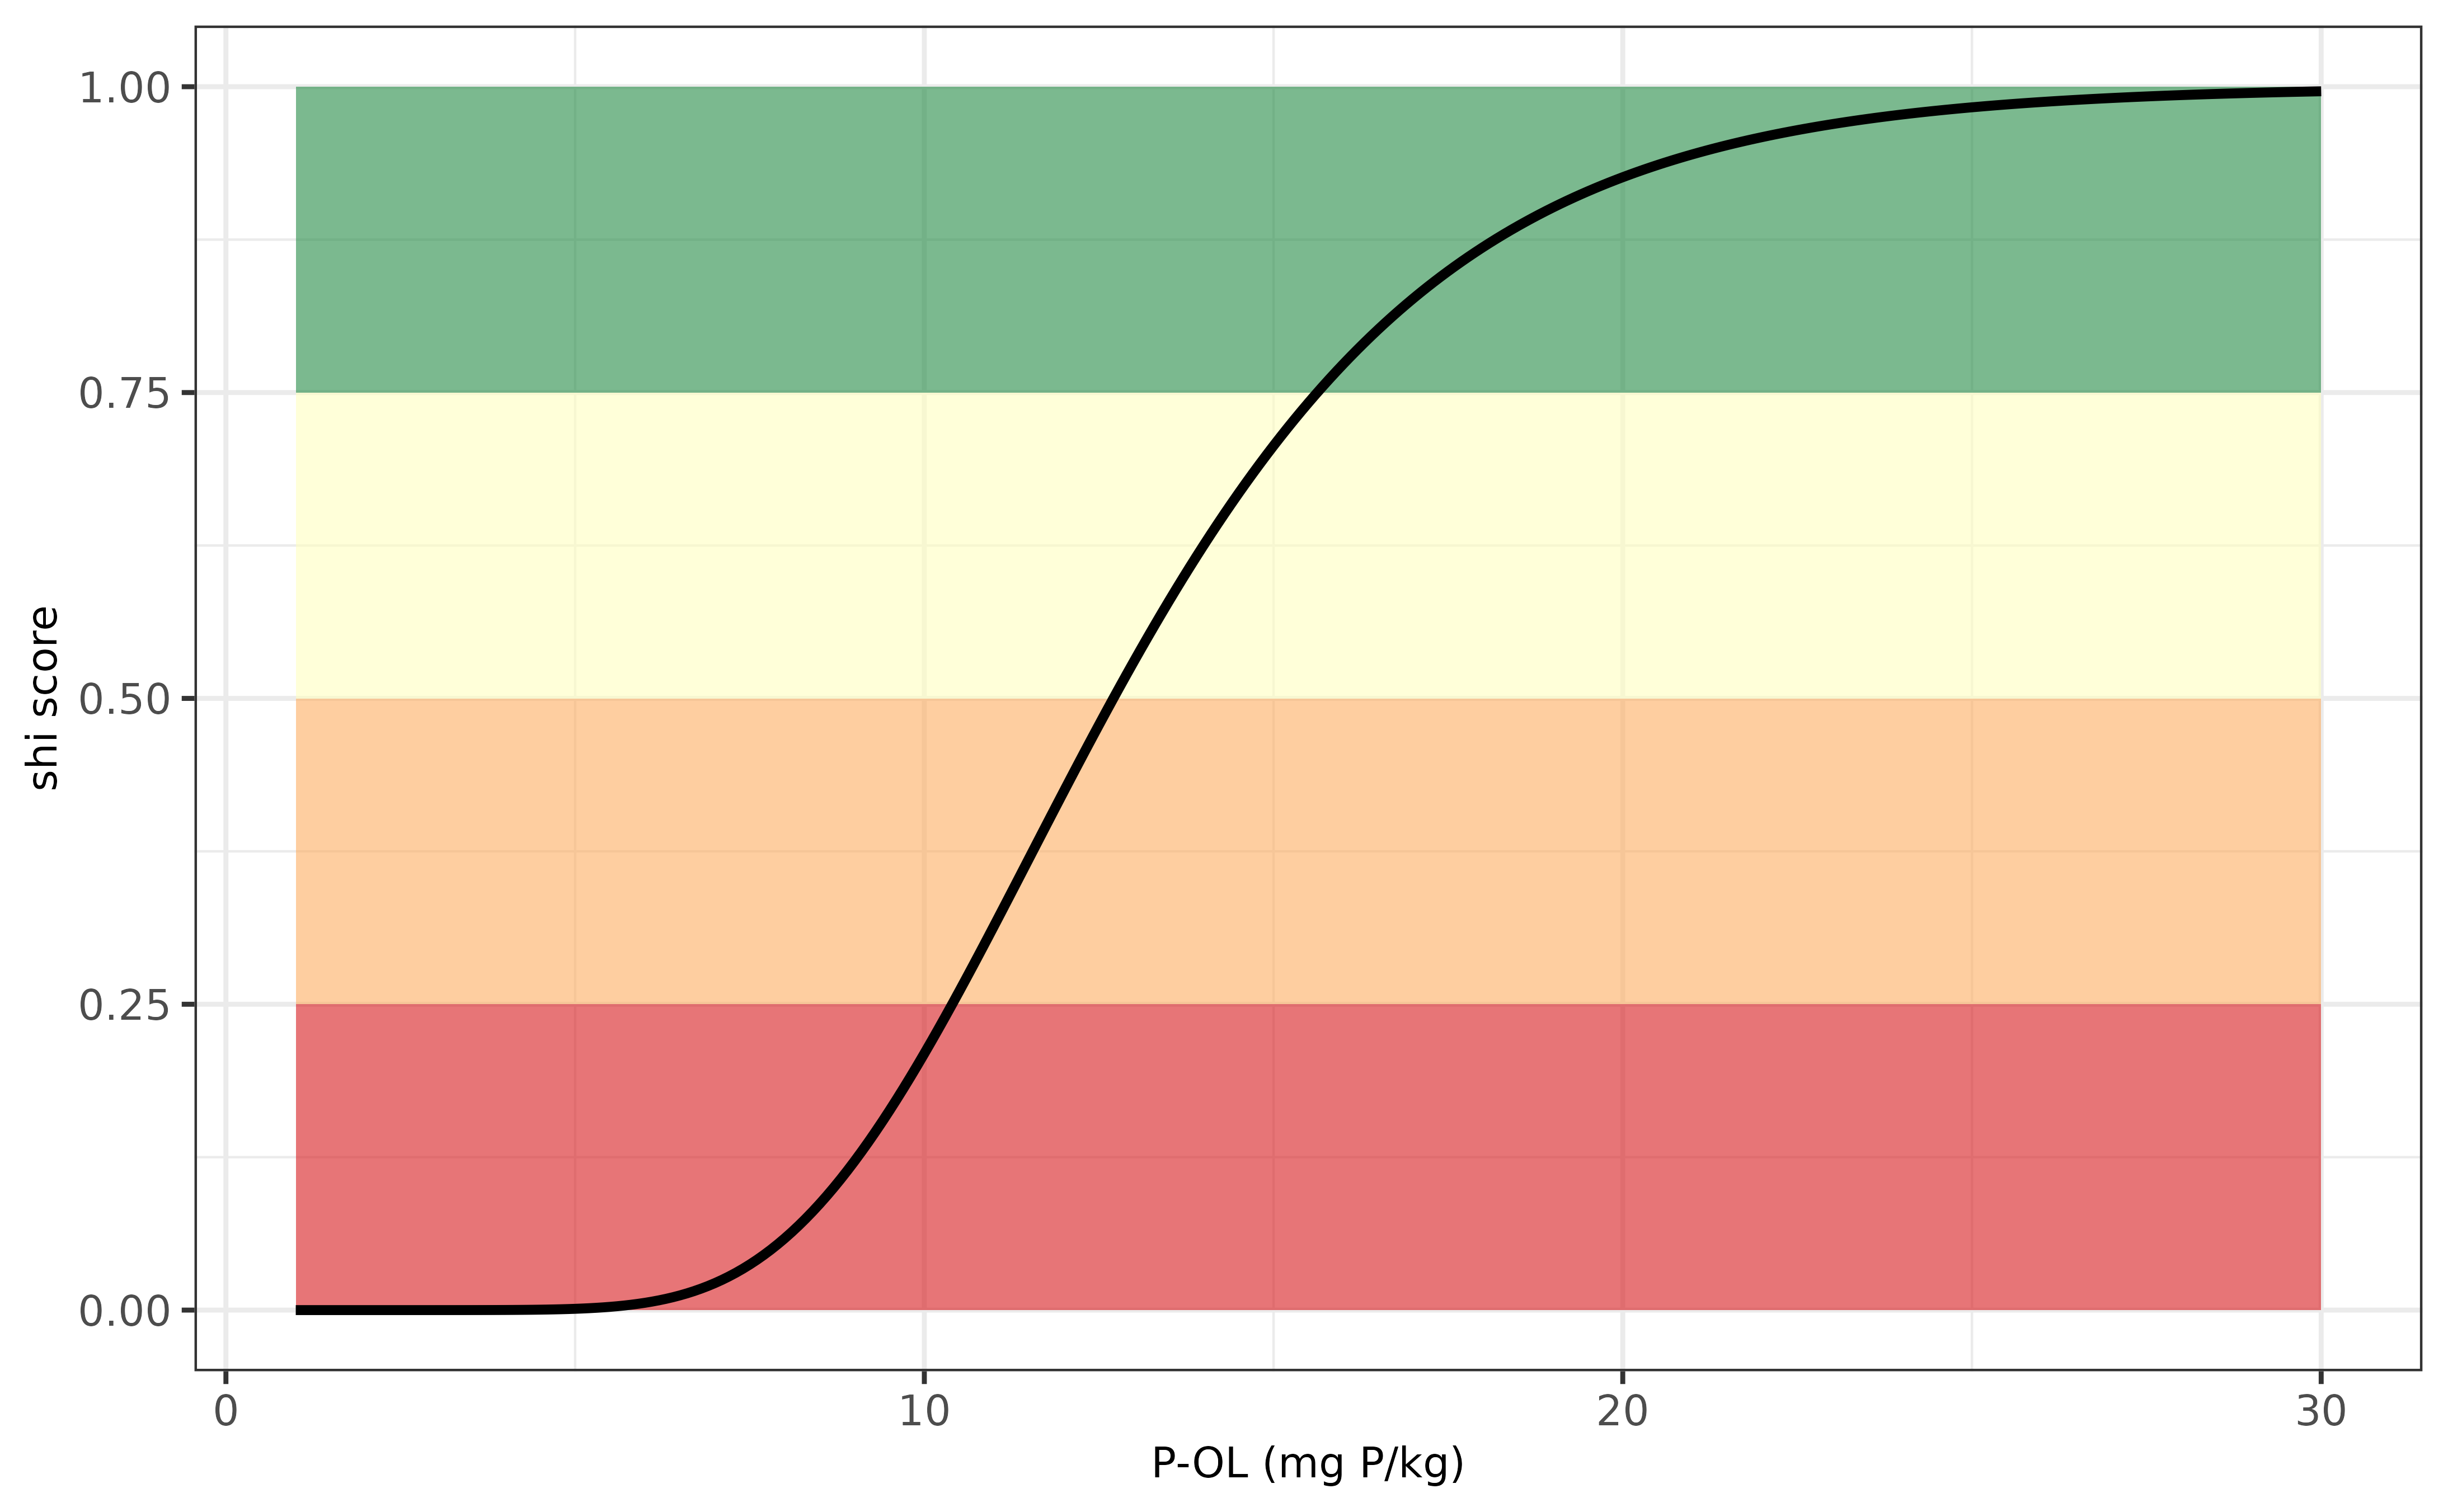
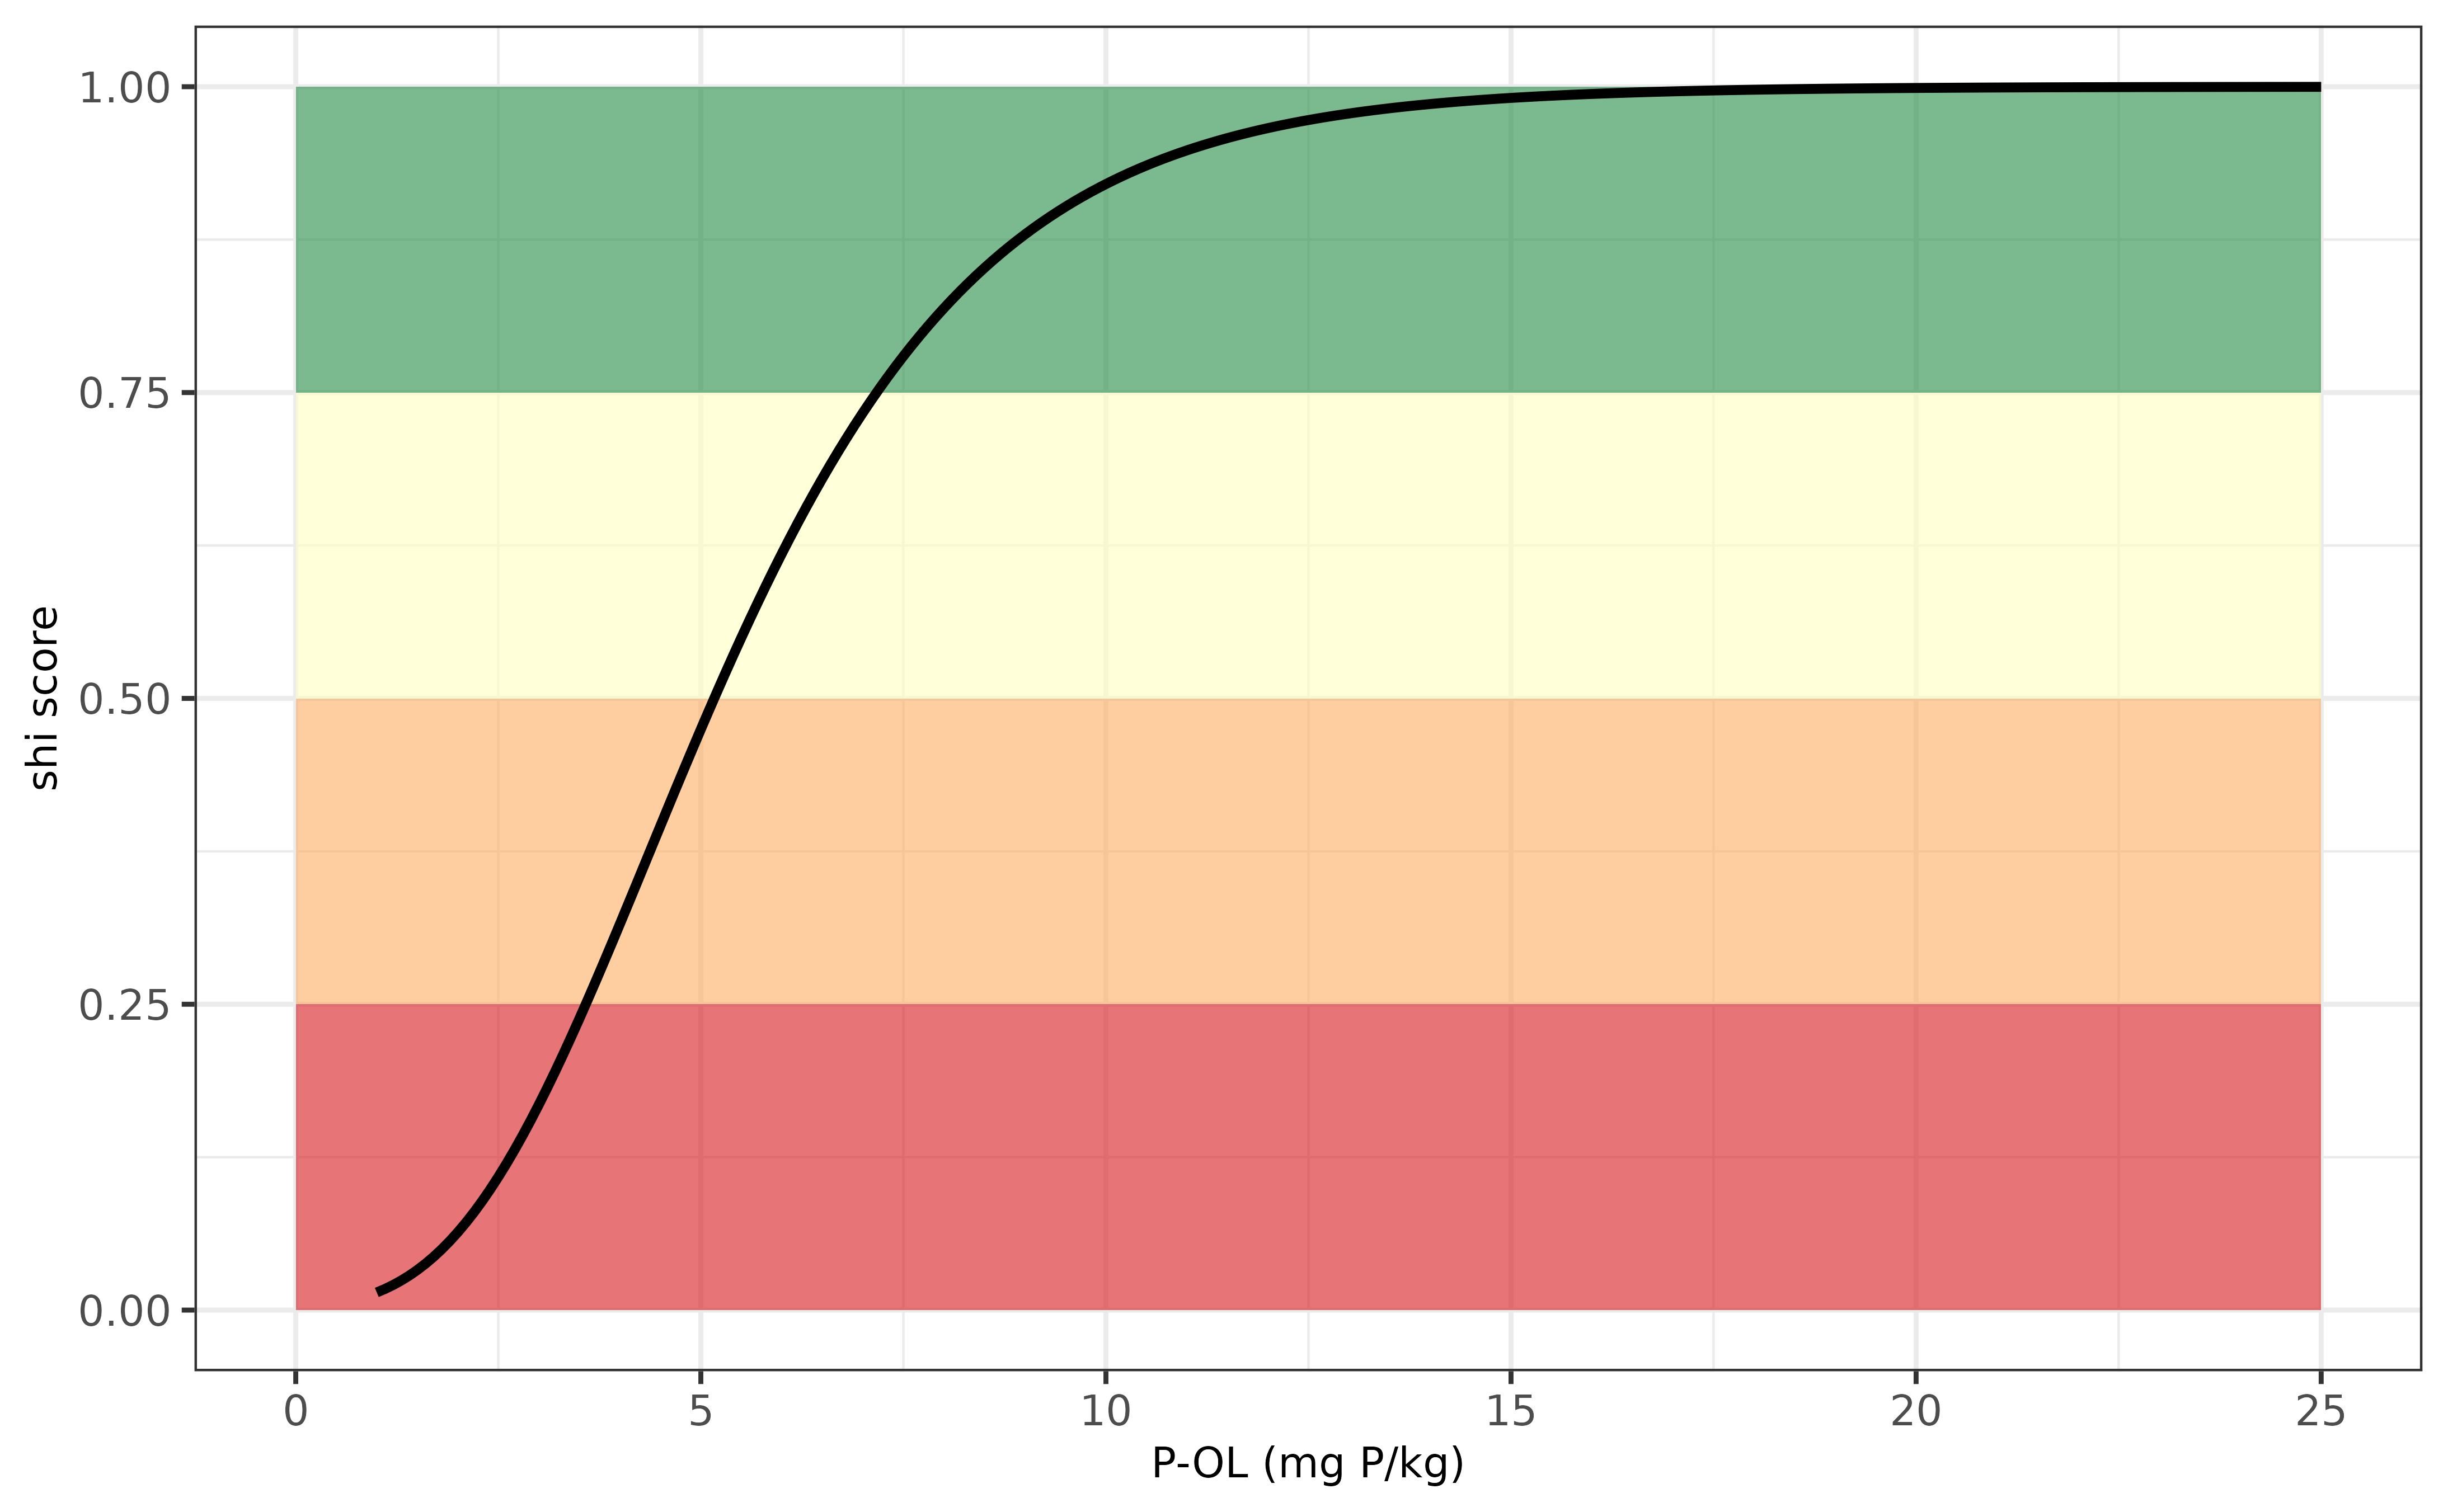
Below an example is visualized how the soil health index varies in relation to variation in P-OL. The optimum soil P threshold value for sustainable crop production is around 18 mg P/ kg, and the soil index decreases when P-OL values decreases down to 10 mg P/kg. There is no differentiation among soil types of land uses.
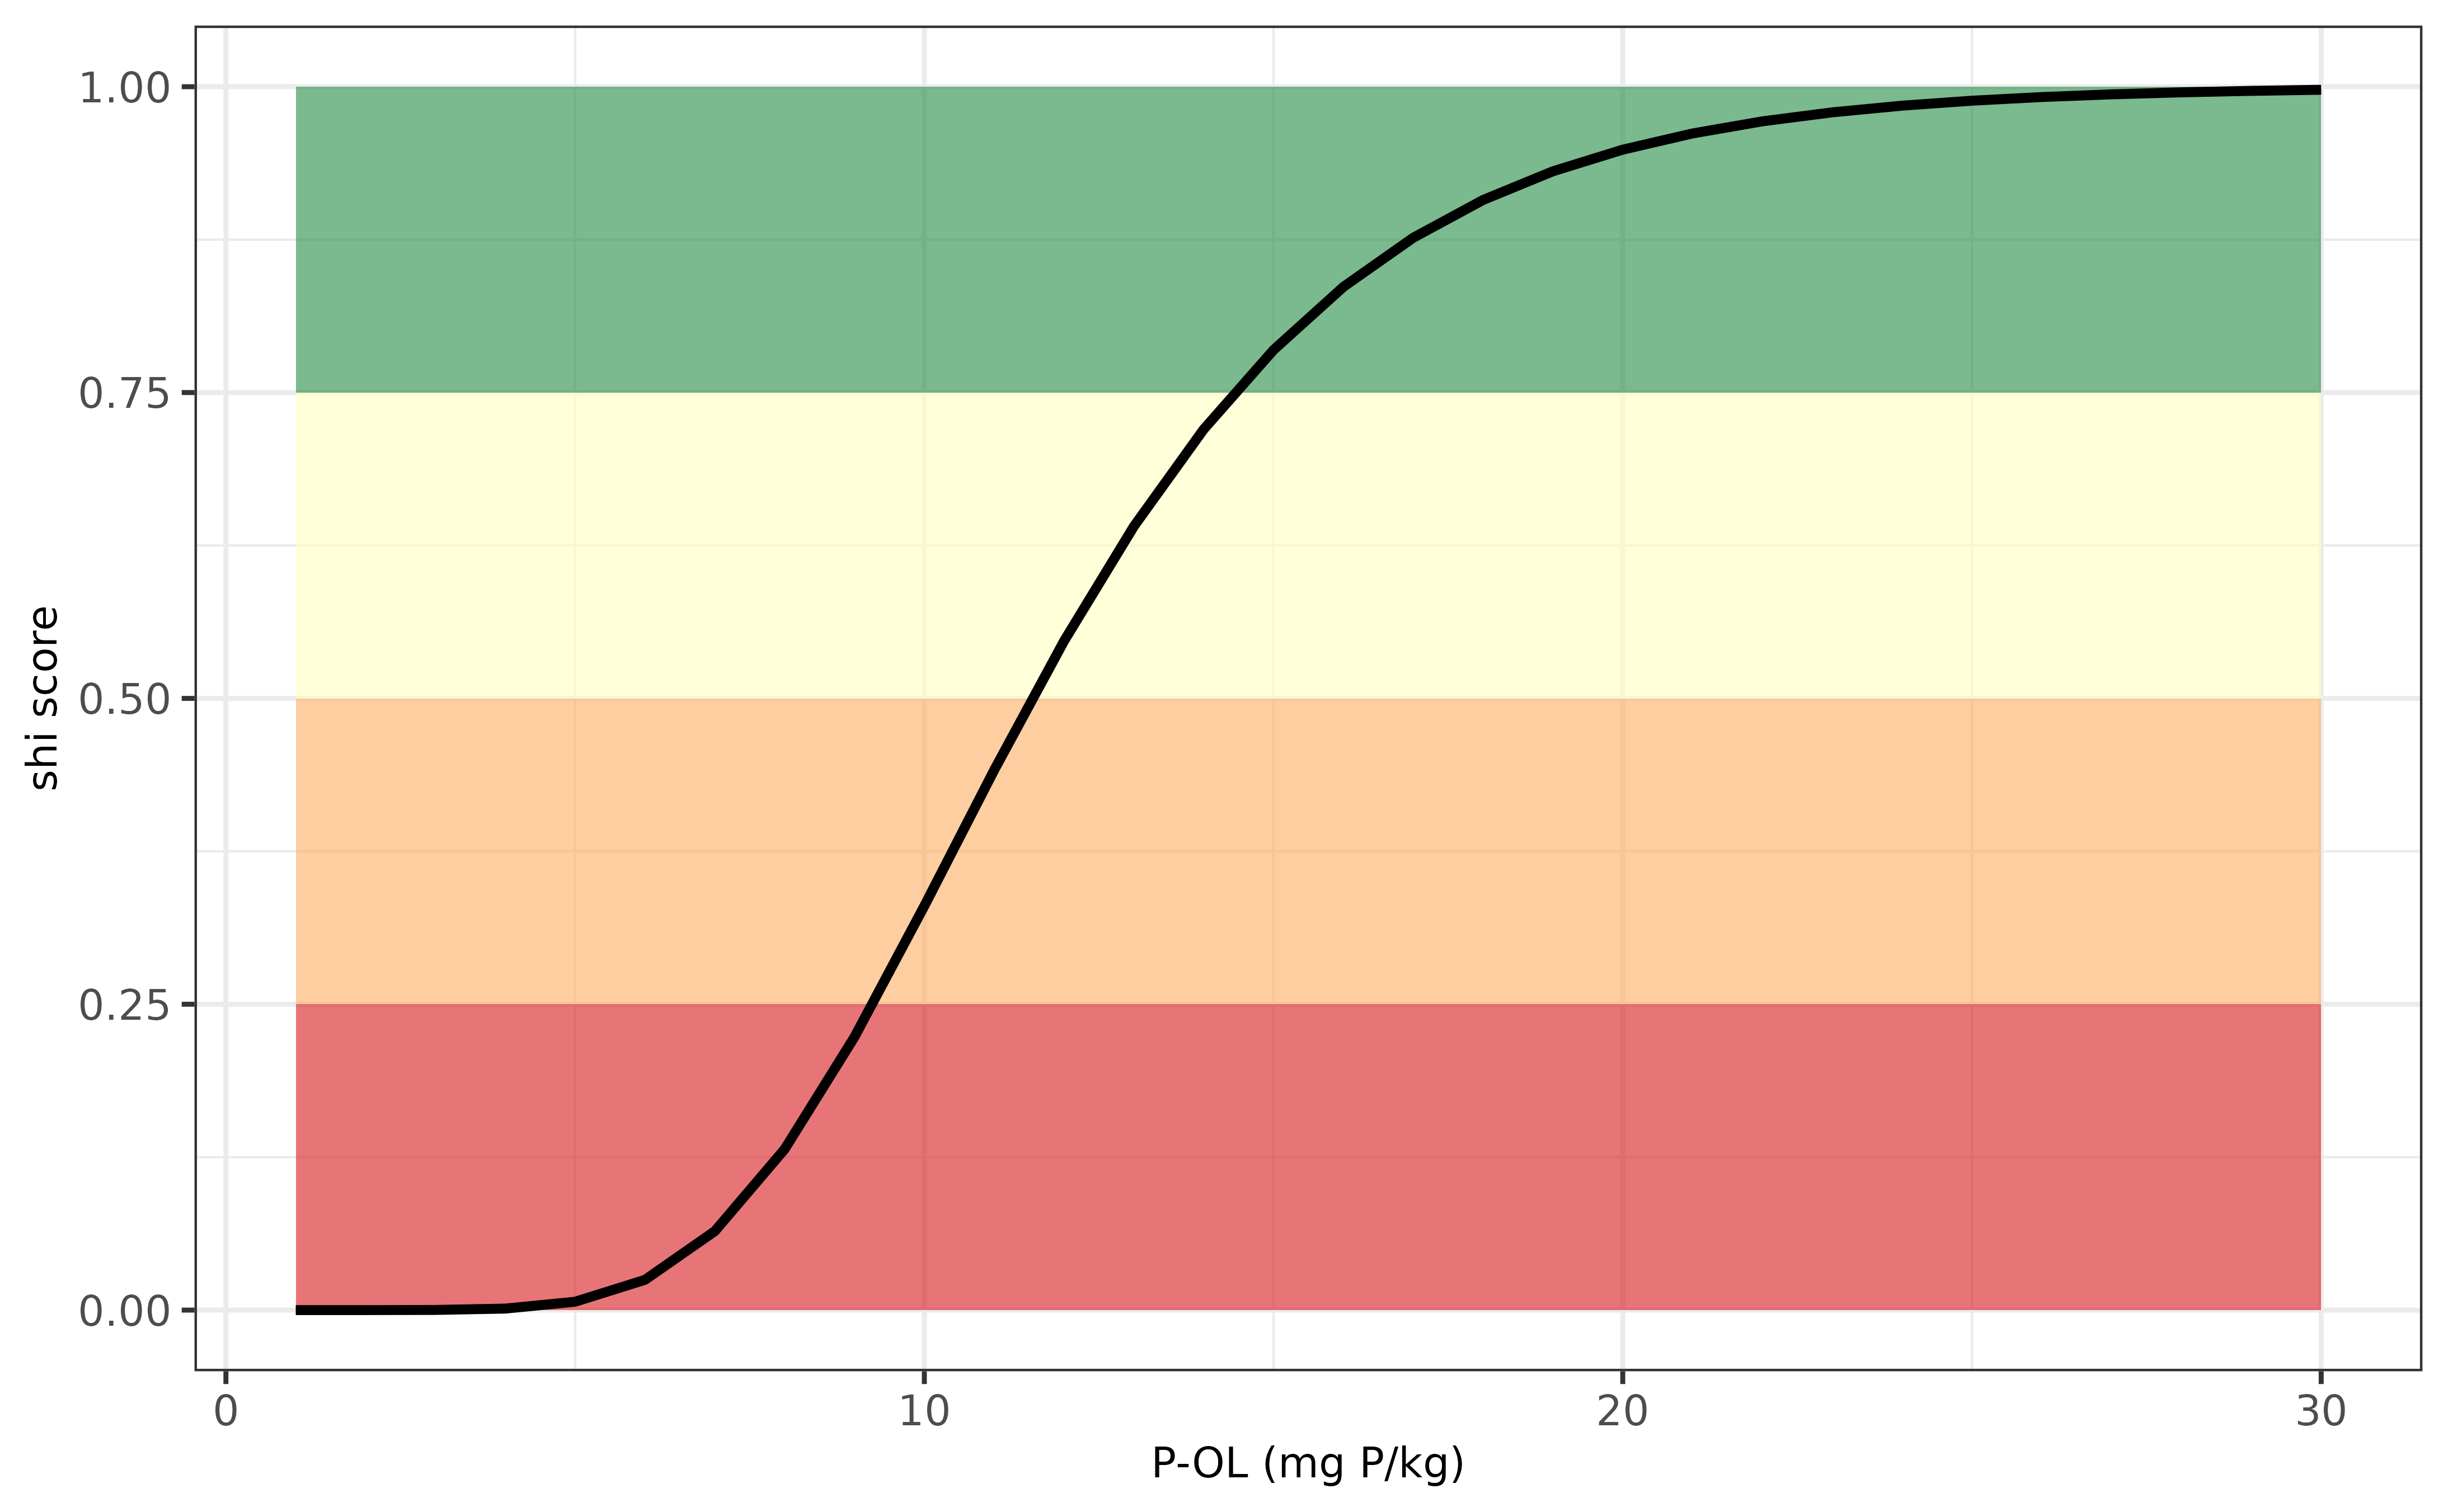
Evaluation P-indicator for Portugal.
Romenia (RO)
The phosphorus supply in view of soil health for agricultural soils
in Romenia can be calculated using osi_c_phosphor_ro using
the following inputs:
- B_LU, being the crop code, an unique number for each crop
- A_P_AL, being the extracted P content with Ammonium Acetate Lacate, unit mg P /kg.
Information on the threshold values for P-AL in view of sustainable
crop production has been derived from the Romenia document entitled
SISTEME DE CULTURI ŞI PLANURI DE FERTILIZARE, a document
that can be downloaded here.
Note that the crop codes for Romenia are not yet available in
osi_crops package table.
Below an example is visualized how the soil health index varies in relation to variation in P-AL. The optimum soil P threshold value for sustainable crop production is around 35 mg P/ kg, and the soil index decreases when P-AL values decreases down to 10 mg P/kg. There is no differentiation among soil types of land uses.

Evaluation P-indicator for Romenia.
Sweden (SE)
The phosphorus supply in view of soil health for agricultural soils
in Sweden can be calculated using osi_c_phosphor_se using
the following inputs:
- B_LU, being the crop code, an unique number for each crop
- A_P_AL, being the extracted P content with ammonium lactate extraction, unit mg P /kg
The P supplying capacity differs per land use type. The threshold values for optimum crop production were derived from the fertilizer guidelines “Rekommendationer för gödsling och kalkning 2025”.
Note that IACS crop codes for Sweden are available in
osi_crops package table.
Below an example is visualized how the soil health index varies in relation to variation in P-AL for three crops. The soil health assessment strongly varies with the highest optimum soil P threshold value ranging from around 90 mg P/kg for potato down to 25 mg P/kg for cereals. Phosphorus deficiency occurs when the P-AL values decrease below around 30 mg P/kg for potato and below 10 mg/kg for cereals. The response for oil crop is in between the other two crops.
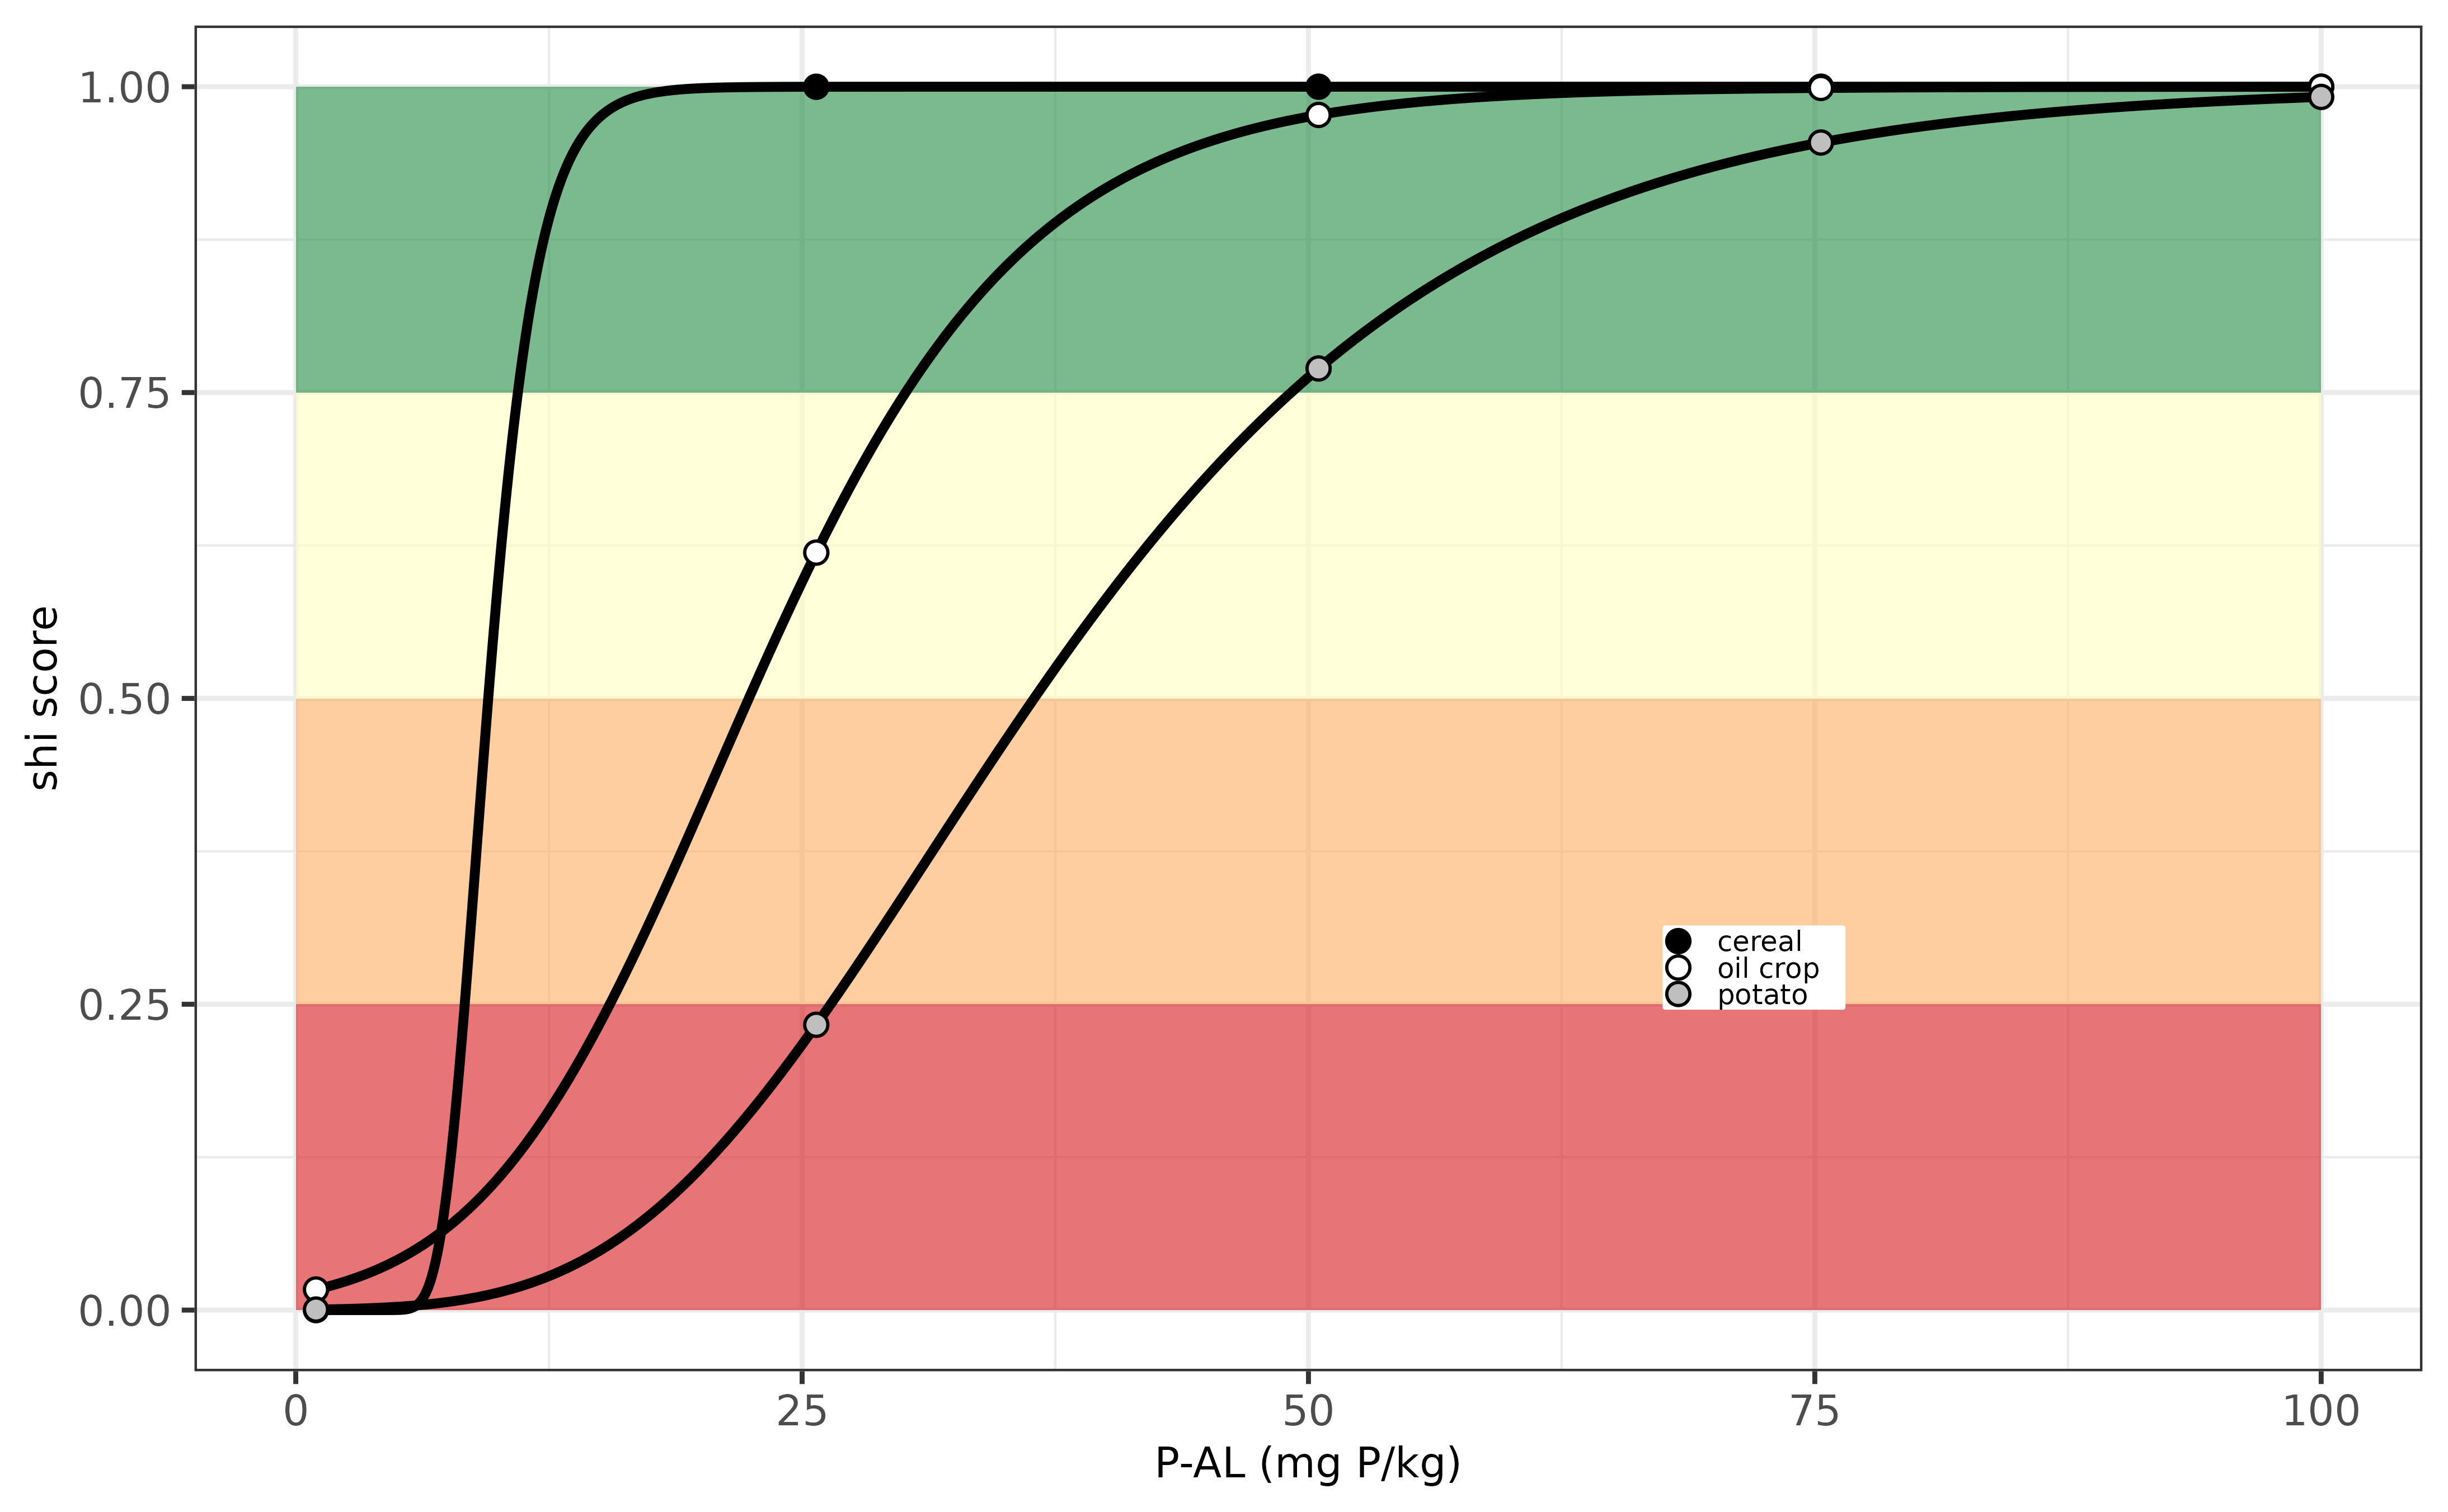
Evaluation P-indicator for Sweden.
Slovak Republic (SK)
The phosphorus supply in view of soil health for agricultural soils
in Slovak Republic can be calculated using
osi_c_phosphor_sk using the following inputs:
- B_LU, being the crop code, an unique number for each crop
- B_TEXTURE_HYPRES, being the soil texture class according to HYPRES classification system
- A_P_M3, being the extracted P content with Mehlich-III extraction, unit mg P /kg.
The P supplying capacity differs in soils with varying textures.
Based on the soil mineralogy (clay, sand and silt content) one can
easily classify the USDA texture class using
osi_get_TEXTURE_HYPRES. Information on the threshold values
for P-Mehlich in view of sustainable crop production has been derived
from Fotyma et al. (2008) who wrote a comprehensive overview of soil
testing methods in Eastern Europe entitled “Soil testing methods and
fertilizer recommendations in Central–Eastern European countries”.
Note that IACS crop codes for Slovak Republic are available in
osi_crops package table.
Below an example is visualized how the soil health index varies in relation to variation in P-M3. The optimum soil P threshold value for sustainable crop production is around 150 mg P/ kg for the three soil types evaluated (clay, sand and loam), and the soil index rapidly decreases when P-M3 values decreases down to 50-70 mg P/kg, with the quickest decline for the sandy soils (low in buffering capacity).
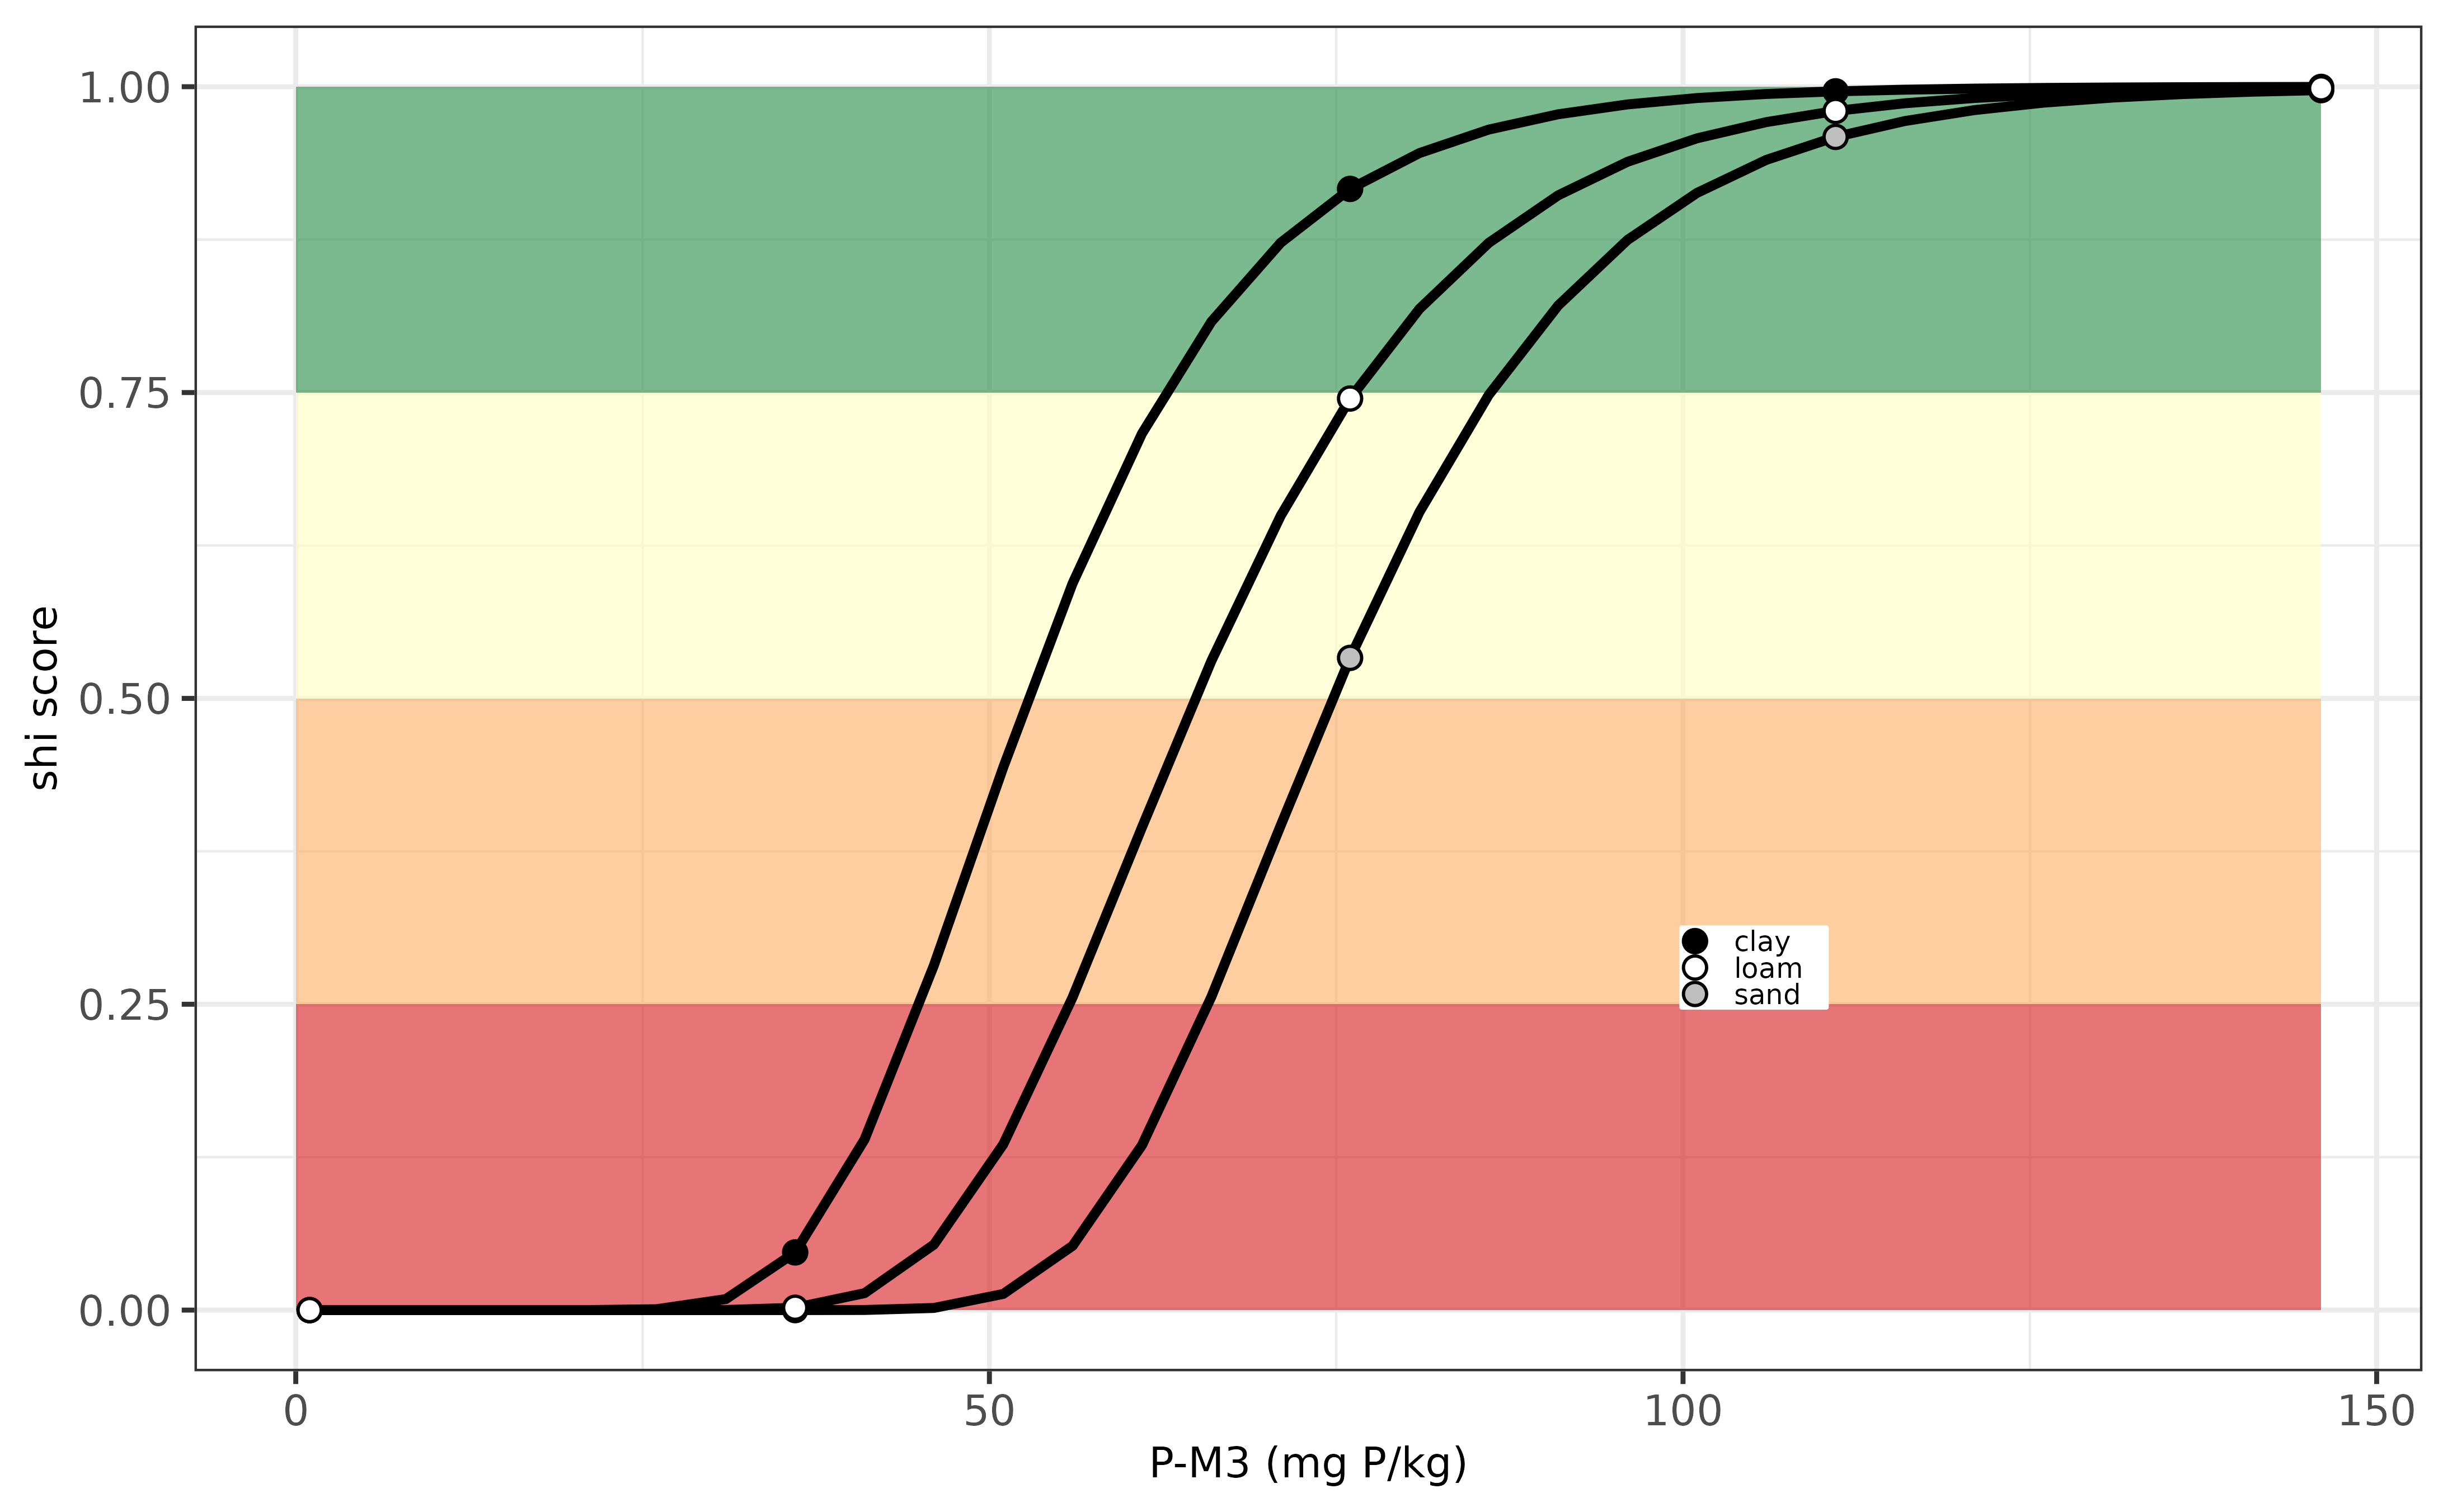
Evaluation P-indicator for Slovak Republic.
Slovenia (SL)
The phosphorus supply in view of soil health for agricultural soils
in Slovenia can be calculated using osi_c_phosphor_sl using
the following inputs:
- B_LU, being the crop code, an unique number for each crop
- A_P_AL, being the extracted P content with Ammonium Lactate extraction, unit mg P/kg.
The P supplying capacity does not differ among soil types or crop types; there is a single optimum threshold defined for all agricultural land. Information on the threshold values for P-AL in view of sustainable crop production has been derived from Fotyma et al. (2008) who wrote a comprehensive overview of soil testing methods in Eastern Europe entitled “Soil testing methods and fertilizer recommendations in Central–Eastern European countries”.
Note that the crop codes for Slovenia are not yet available in
osi_crops package table.
Below an example is visualized how the soil health index varies in relation to variation in P-AL. The optimum soil P threshold value for sustainable crop production is around 80 mg P/ kg for the three soil types evaluated (clay, sand and loam), and the soil index rapidly decreases when P-AL values decreases down to 30 mg P/kg.
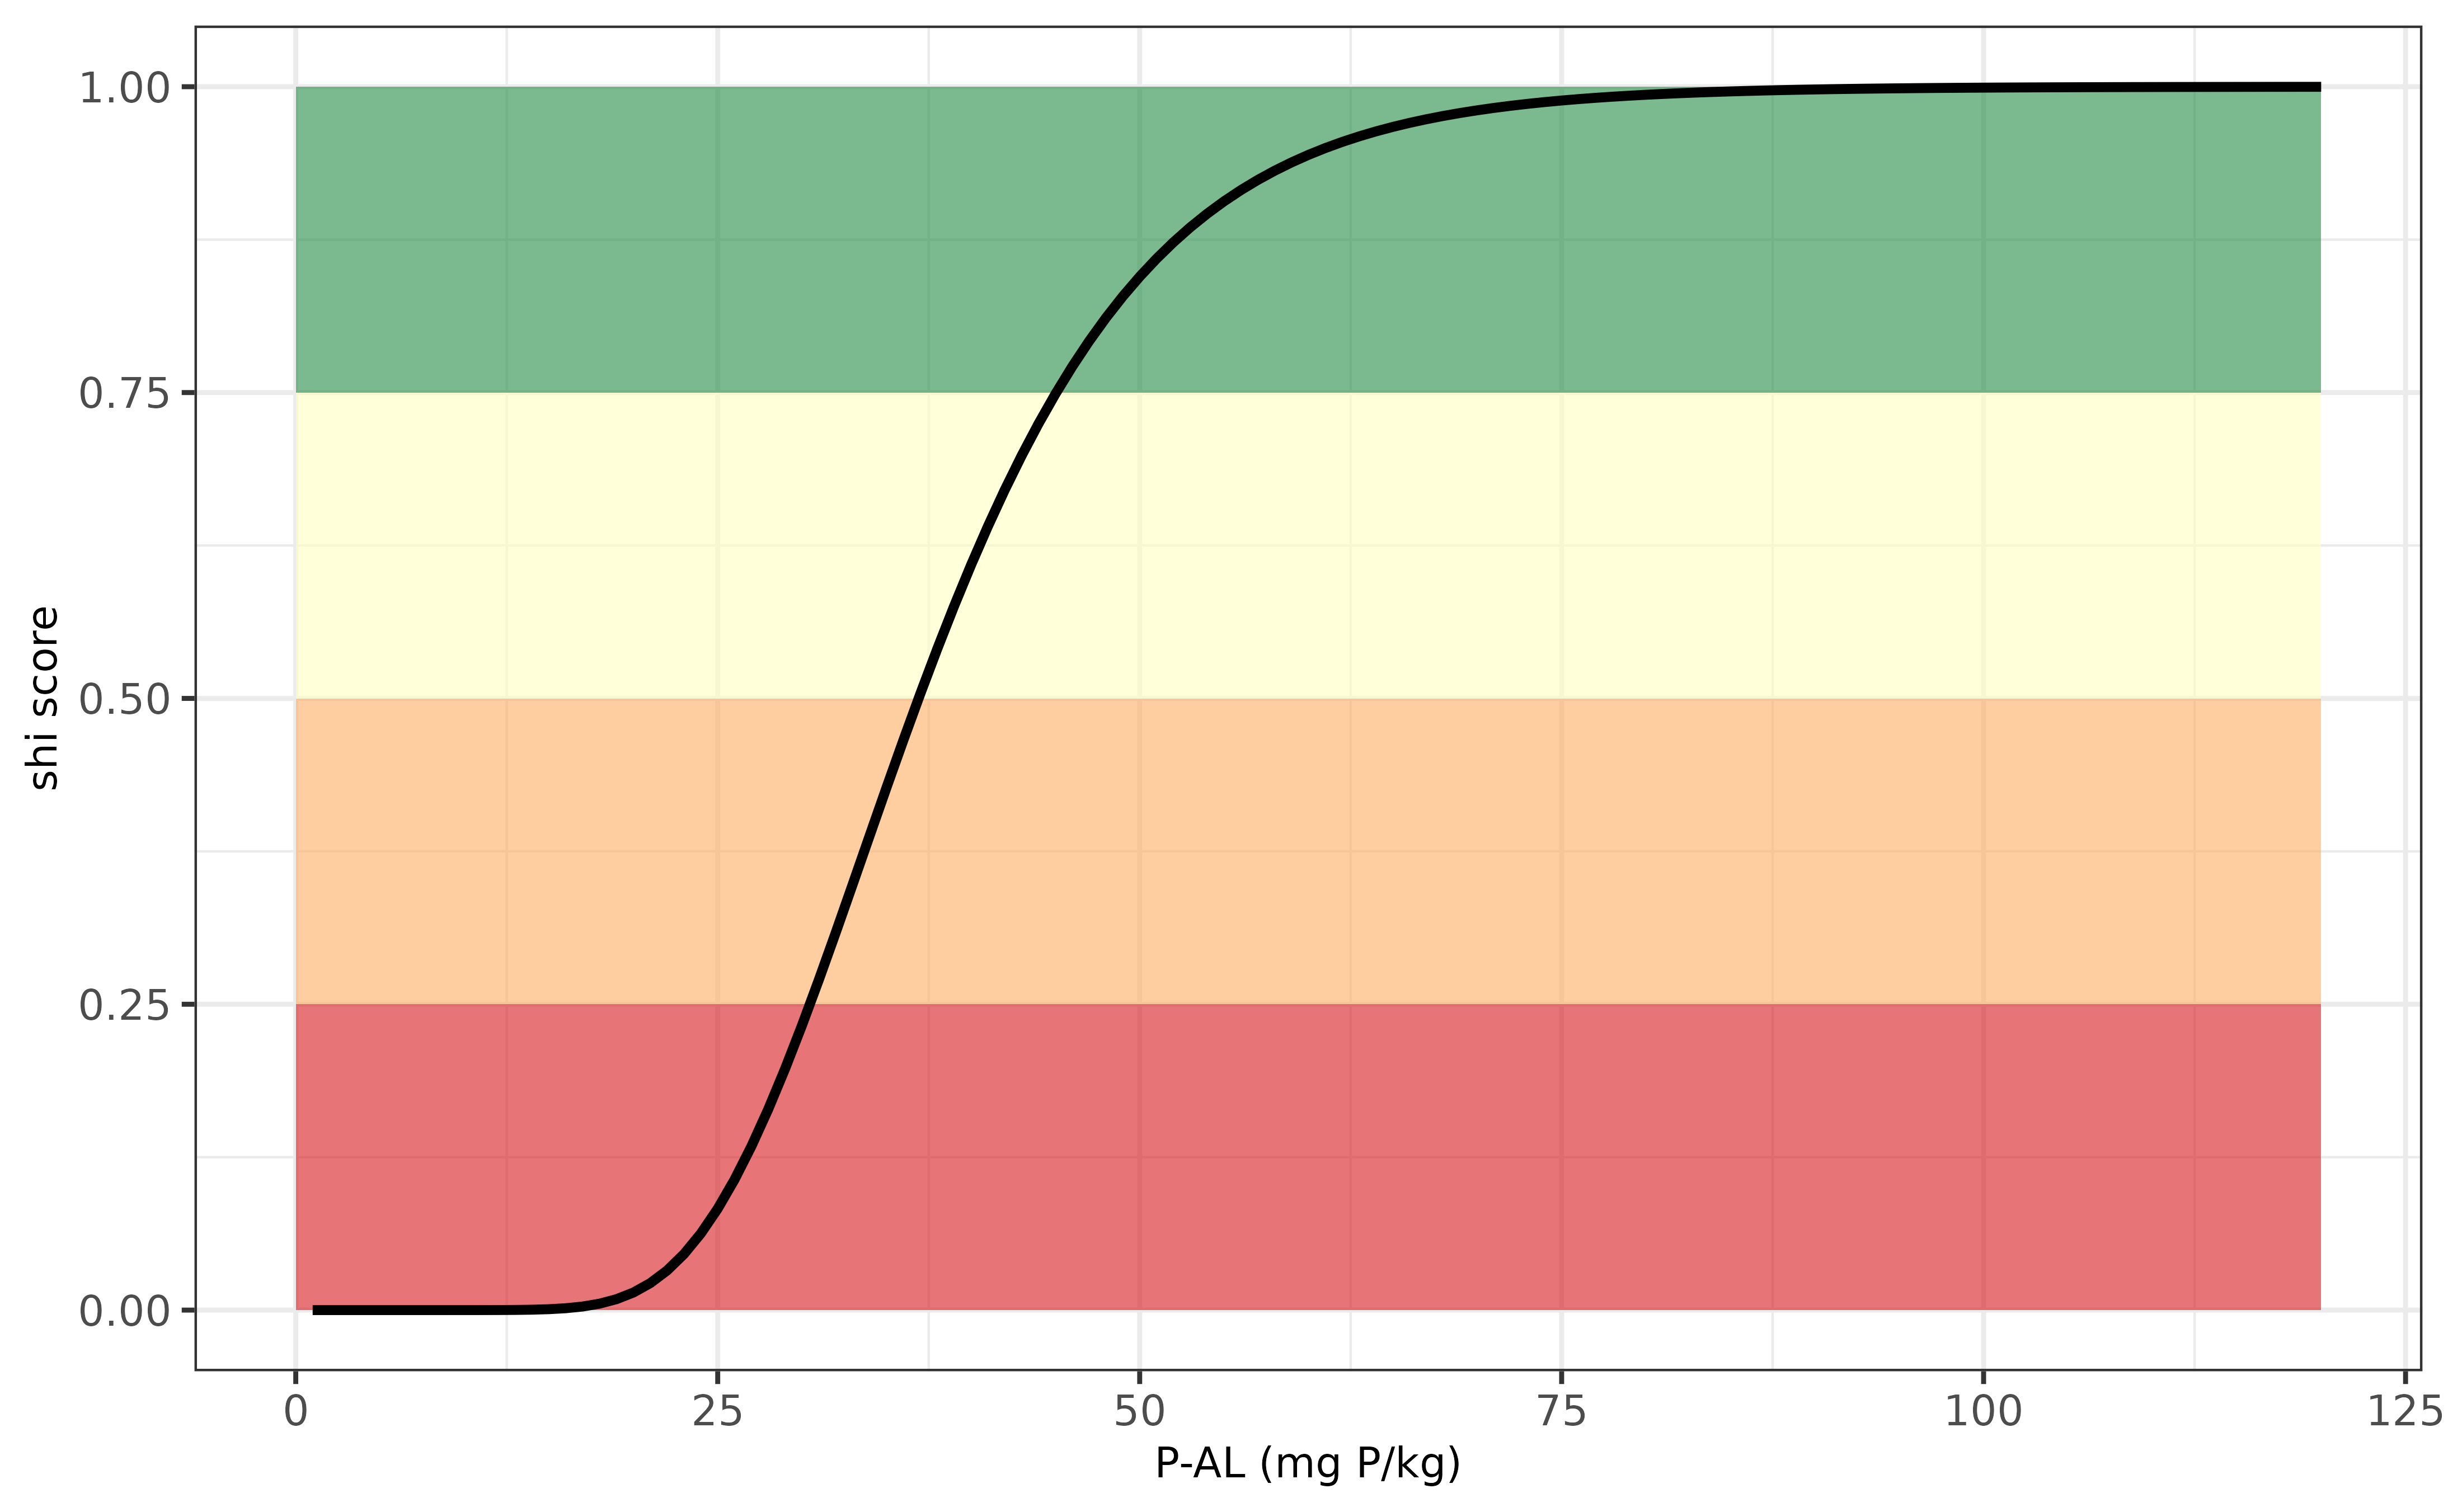
Evaluation P-indicator for Slovenia.
United Kingdom (UK)
The phosphorus supply in view of soil health for agricultural soils
in United Kingdom can be calculated using osi_c_phosphor_uk
using the following inputs:
- B_LU, being the crop code, an unique number for each crop
- A_P_OL, being the extracted P content with the Olsen method, unit mg P /kg
- A_SOM_LOI, being the organic matter content, unit in percentage (%), being used to convert the P-Olsen to the P-index classification system used in the UK.
The P supplying capacity differs among soil textures, but in the UK the evaluation of the P supply is similar for all soil types but it varies for grassland and crop land. Information on the threshold values for P-Olsen in view of sustainable crop production can be found on the website of AHDB. A more detailed table can be found here
Note that the crop codes for the UK are not yet available in
osi_crops package table. For now, the B_LU code is used to
differentiate between vegetables and non-vegetables.
Below an example is visualized how the soil health index varies in relation to variation in P-Olsen. The optimum soil P threshold value for sustainable crop production is around 15 mg P/ kg for grassland and around 25 for potato crop. Phosphorus deficiency occurs when the P-OL value decreases below around 7.5 to 15 mg P/kg.
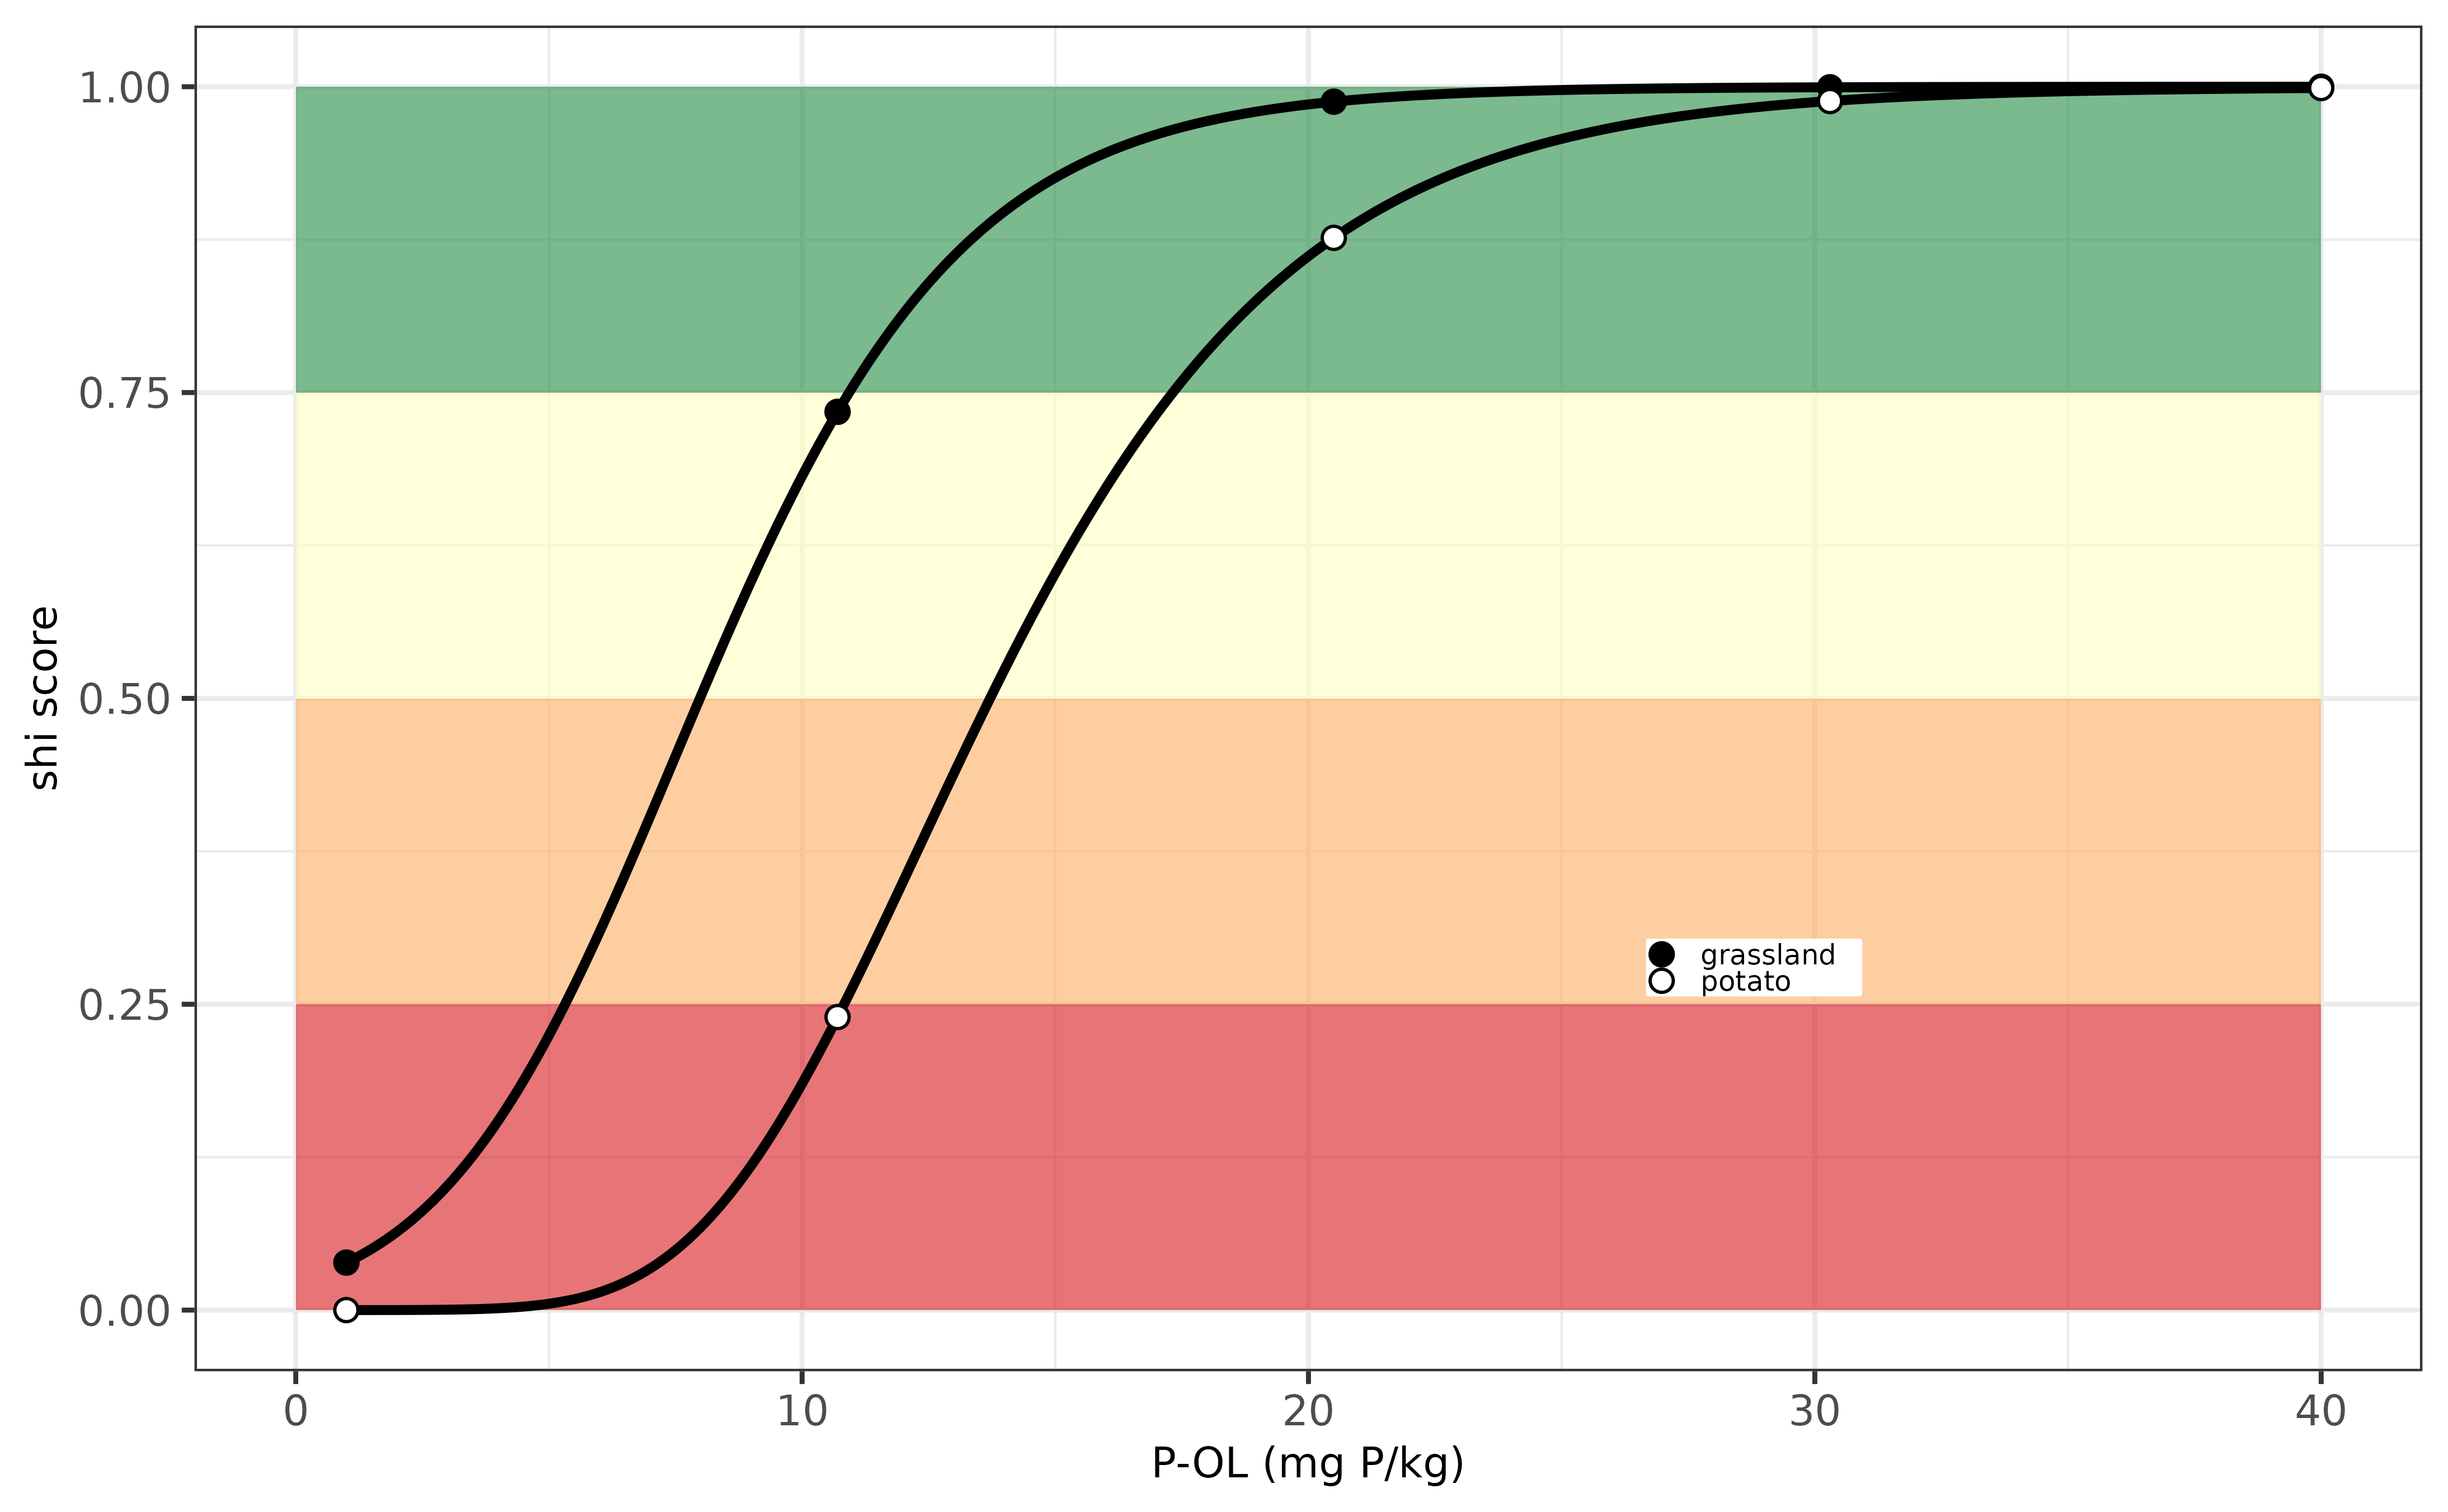
Evaluation P-indicator for the UK.